What Does Slope Of V-t Graph Represent
listenit
Mar 24, 2025 · 6 min read
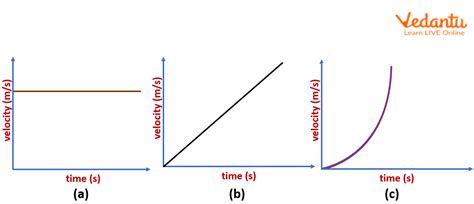
Table of Contents
What Does the Slope of a V-T Graph Represent? A Comprehensive Guide
The velocity-time graph (v-t graph) is a fundamental tool in physics and kinematics, providing a visual representation of an object's motion. Understanding what each aspect of the graph represents is crucial for analyzing motion and solving related problems. This article delves deep into the meaning of the slope of a v-t graph, exploring its significance, applications, and implications in various scenarios. We’ll also discuss how the slope relates to acceleration, both in constant and non-constant acceleration situations.
Understanding the V-T Graph
Before diving into the slope, let's establish a clear understanding of the v-t graph itself. The horizontal axis (x-axis) represents time (t), typically measured in seconds (s). The vertical axis (y-axis) represents velocity (v), usually measured in meters per second (m/s) or other suitable units depending on the context (e.g., km/h, mph).
Each point on the graph represents the velocity of the object at a specific point in time. A straight line indicates constant acceleration or deceleration, while a curved line shows a changing acceleration. The area under the curve represents the displacement of the object – the total distance covered considering direction.
The Slope: The Key to Understanding Acceleration
The slope of a v-t graph represents the acceleration of the object. This is a crucial concept in kinematics. The slope is calculated by finding the change in velocity (Δv) divided by the change in time (Δt):
Acceleration (a) = Δv / Δt = (v₂ - v₁) / (t₂ - t₁)
Where:
- v₂ is the final velocity
- v₁ is the initial velocity
- t₂ is the final time
- t₁ is the initial time
Interpreting the Slope: Positive, Negative, and Zero
The sign of the slope provides important information about the direction of the acceleration:
-
Positive Slope: A positive slope indicates positive acceleration, meaning the object's velocity is increasing over time. This could represent an object speeding up in the positive direction or slowing down in the negative direction (deceleration in the negative direction).
-
Negative Slope: A negative slope indicates negative acceleration, also known as deceleration or retardation. This means the object's velocity is decreasing over time. This could represent an object slowing down in the positive direction or speeding up in the negative direction (acceleration in the negative direction).
-
Zero Slope: A zero slope indicates zero acceleration, meaning the object's velocity is constant. The object is neither speeding up nor slowing down; it's moving at a uniform velocity.
Examples: Visualizing the Slope's Meaning
Let's examine some scenarios to illustrate the relationship between the slope of the v-t graph and acceleration:
Scenario 1: Constant Positive Acceleration
Imagine a car accelerating uniformly from rest. The v-t graph would show a straight line with a positive slope. The steeper the line, the greater the acceleration. The slope's value directly corresponds to the car's constant acceleration. For example, a slope of 5 m/s² indicates a constant acceleration of 5 meters per second squared.
Scenario 2: Constant Negative Acceleration (Deceleration)
Consider a car braking uniformly to a stop. The v-t graph would show a straight line with a negative slope. The steeper the line (more negative), the greater the deceleration. The slope's value, being negative, represents the rate at which the velocity is decreasing.
Scenario 3: Non-Uniform Acceleration
In real-world scenarios, acceleration is rarely constant. A car might accelerate quickly, then decelerate, or maintain a constant speed for a period. In such cases, the v-t graph will be a curve, and the slope will change continuously along the curve. At any specific point on the curve, the slope of the tangent line to the curve represents the instantaneous acceleration at that moment.
Scenario 4: Zero Acceleration (Constant Velocity)
If an object is moving at a constant velocity, its v-t graph will be a horizontal line. The slope of a horizontal line is zero, indicating zero acceleration. This means the object's velocity remains unchanged over time.
Calculating Acceleration from the Slope: Practical Applications
The ability to determine acceleration from the slope of a v-t graph has numerous practical applications:
-
Determining the acceleration of vehicles: Analyzing data from a vehicle's speedometer can provide a v-t graph, enabling the calculation of acceleration and deceleration during different phases of travel. This is important for safety analysis and performance evaluation.
-
Analyzing projectile motion: The v-t graph of a projectile can reveal its acceleration due to gravity, which is approximately constant near the Earth's surface. The slope of the graph will be negative (due to gravity acting downwards), and its magnitude will be approximately 9.8 m/s².
-
Studying the motion of falling objects: Experimentally obtaining data on the velocity of a falling object over time allows for the creation of a v-t graph. This graph can then be used to analyze the object's acceleration and potentially identify the presence of air resistance.
-
Analyzing the performance of athletes: Tracking the speed of an athlete during a race can generate a v-t graph. The analysis of the slope can reveal crucial information about their acceleration and deceleration phases, helping in performance optimization.
Beyond the Basics: Instantaneous Acceleration and Calculus
For non-uniform acceleration scenarios where the v-t graph is a curve, the concept of instantaneous acceleration becomes critical. The instantaneous acceleration at any point is the slope of the tangent line to the curve at that specific point. Calculating the instantaneous acceleration often requires the use of calculus – specifically, finding the derivative of the velocity function with respect to time.
The derivative, dv/dt, represents the instantaneous rate of change of velocity, which is precisely the instantaneous acceleration. This allows for a precise analysis of motion even when acceleration is not constant.
Connecting the V-T Graph to Other Kinematic Graphs
The v-t graph is interconnected with other kinematic graphs, namely the displacement-time graph (s-t graph) and the acceleration-time graph (a-t graph).
-
Relationship with s-t graph: The area under the v-t curve represents the displacement of the object. This means that integrating the velocity function over time gives the displacement function.
-
Relationship with a-t graph: The v-t graph is the integral of the a-t graph. This means that the area under the a-t curve represents the change in velocity. Conversely, the slope of the v-t graph represents the acceleration, which is displayed directly on the a-t graph.
Conclusion
The slope of a v-t graph is a powerful tool for understanding and analyzing the motion of objects. Its significance lies in its direct representation of acceleration, enabling us to determine whether an object is speeding up, slowing down, or maintaining a constant velocity. Whether dealing with constant or non-constant acceleration, understanding the slope's implications is crucial for solving kinematic problems and gaining a deeper insight into the dynamics of motion. From analyzing vehicle performance to understanding projectile motion, the applications of this concept are vast and indispensable in various fields of physics and engineering. The connection to calculus further enhances the analytical power of the v-t graph, allowing for precise calculations of instantaneous acceleration and a comprehensive understanding of complex motion patterns.
Latest Posts
Latest Posts
-
What Is The Correct Formula For Barium Phosphate
Mar 26, 2025
-
Is 37 A Prime Or Composite Number
Mar 26, 2025
-
How Many Valence Electrons In P
Mar 26, 2025
-
What Causes The Alpha Particles To Deflect Backwards
Mar 26, 2025
-
64 To The Power Of 1 3
Mar 26, 2025
Related Post
Thank you for visiting our website which covers about What Does Slope Of V-t Graph Represent . We hope the information provided has been useful to you. Feel free to contact us if you have any questions or need further assistance. See you next time and don't miss to bookmark.
