Which Is The Graph Of 4x + 2y 3
listenit
Mar 19, 2025 · 5 min read
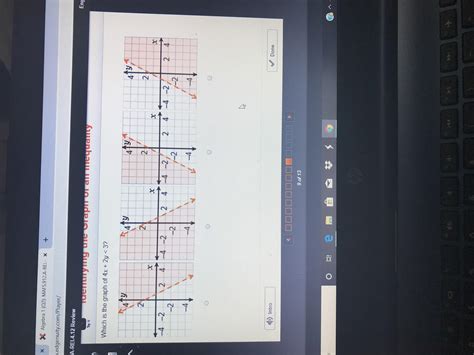
Table of Contents
Which is the Graph of 4x + 2y ≤ 3? A Comprehensive Guide to Linear Inequalities
Understanding linear inequalities is crucial for various mathematical applications, from linear programming to data analysis. This article will delve deep into the inequality 4x + 2y ≤ 3, explaining how to graph it accurately and interpreting its meaning. We'll cover the steps involved, address common misconceptions, and explore related concepts to provide a comprehensive understanding.
Understanding Linear Inequalities
Before we tackle the specific inequality, let's review the fundamental concepts of linear inequalities. A linear inequality involves two expressions connected by an inequality symbol: < (less than), > (greater than), ≤ (less than or equal to), or ≥ (greater than or equal to). Unlike linear equations, which have a single solution, linear inequalities have a range of solutions, typically represented graphically as a shaded region.
The general form of a linear inequality is Ax + By ≤ C (or with other inequality symbols). A, B, and C are constants, and x and y are variables. Our specific inequality, 4x + 2y ≤ 3, fits this form.
Steps to Graph 4x + 2y ≤ 3
Graphing a linear inequality involves several steps:
1. Rewrite the Inequality as an Equation
The first step is to treat the inequality as an equation: 4x + 2y = 3. This allows us to find the boundary line of our solution region.
2. Find the x and y-intercepts
To graph the line, we need at least two points. The easiest points to find are the x and y-intercepts.
-
x-intercept: To find the x-intercept, set y = 0 and solve for x: 4x + 2(0) = 3 4x = 3 x = 3/4 = 0.75
-
y-intercept: To find the y-intercept, set x = 0 and solve for y: 4(0) + 2y = 3 2y = 3 y = 3/2 = 1.5
Therefore, the line passes through the points (0.75, 0) and (0, 1.5).
3. Plot the Line
Plot the points (0.75, 0) and (0, 1.5) on a coordinate plane and draw a straight line through them. Crucially, because the inequality is "less than or equal to," the line should be solid, indicating that points on the line are included in the solution set. If the inequality were simply "<", the line would be dashed.
4. Choose a Test Point
Select a point not on the line. The origin (0, 0) is often the easiest to use, unless the line passes through the origin. Substitute the coordinates of this test point into the original inequality.
5. Determine the Shaded Region
Substitute the coordinates of the test point (0,0) into the inequality 4x + 2y ≤ 3:
4(0) + 2(0) ≤ 3 0 ≤ 3
This statement is true. Since the inequality is true for the test point, shade the region containing the test point. This region represents all the points (x, y) that satisfy the inequality 4x + 2y ≤ 3. If the statement had been false, you would shade the region opposite to the test point.
Interpreting the Graph
The shaded region on your graph represents the solution set of the inequality 4x + 2y ≤ 3. Every point within this shaded region, including the points on the solid line, satisfies the inequality. This means that if you substitute the x and y coordinates of any point in the shaded region into the inequality 4x + 2y ≤ 3, the resulting statement will be true.
Points outside the shaded region do not satisfy the inequality; substituting their coordinates will yield a false statement.
Common Mistakes to Avoid
Several common mistakes can occur when graphing linear inequalities:
- Incorrect line type: Remember to use a solid line for ≤ or ≥ and a dashed line for < or >.
- Shading the wrong region: Always test a point to determine which region to shade. Incorrect shading leads to an inaccurate representation of the solution set.
- Arithmetic errors: Carefully calculate the x and y intercepts to avoid plotting the line incorrectly.
- Misinterpreting the inequality symbol: Pay close attention to whether the inequality is inclusive (≤ or ≥) or exclusive (< or >).
Extending the Concept: Systems of Linear Inequalities
The techniques discussed above can be extended to systems of linear inequalities, where you have multiple inequalities to graph simultaneously. The solution to a system of inequalities is the region where the shaded regions of all the individual inequalities overlap.
For example, consider the system:
4x + 2y ≤ 3 x ≥ 0 y ≥ 0
Graphing each inequality separately and finding the overlapping region will provide the solution to this system. This overlapping region would be bounded by the line 4x + 2y = 3 and the x and y axes.
Real-World Applications
Linear inequalities have numerous real-world applications, including:
- Resource allocation: Businesses use linear inequalities to optimize resource allocation, maximizing profit while staying within budget constraints.
- Production planning: Manufacturers use linear programming (which relies heavily on inequalities) to determine the optimal production levels of different products.
- Financial modeling: Financial analysts use linear inequalities in risk management and portfolio optimization.
- Scheduling problems: Linear inequalities help solve scheduling problems in various industries, ensuring efficient use of resources.
Conclusion
Graphing the inequality 4x + 2y ≤ 3 involves straightforward steps: rewriting it as an equation, finding intercepts, plotting the line, choosing a test point, and shading the appropriate region. Understanding these steps and avoiding common mistakes is crucial for accurately representing the solution set. The ability to graph linear inequalities and systems of linear inequalities is fundamental to many areas of mathematics and its applications in the real world. Mastering this skill provides a valuable foundation for more advanced mathematical concepts and problem-solving. Remember to always double-check your work and ensure that your graph accurately represents the solution set of the given inequality. Practice with various inequalities will solidify your understanding and build confidence in tackling more complex problems.
Latest Posts
Latest Posts
-
Quarter Pound Is How Many Ounces
Mar 19, 2025
-
Look At The Figure Find The Value Of X
Mar 19, 2025
-
21 Is What Percent Of 70
Mar 19, 2025
-
Can A Rectangle Be A Trapezoid
Mar 19, 2025
-
Name The Muscle That Subdivides The Ventral Body Cavity
Mar 19, 2025
Related Post
Thank you for visiting our website which covers about Which Is The Graph Of 4x + 2y 3 . We hope the information provided has been useful to you. Feel free to contact us if you have any questions or need further assistance. See you next time and don't miss to bookmark.
