The Graph Of A Quadratic Function Is Called
listenit
Mar 15, 2025 · 6 min read
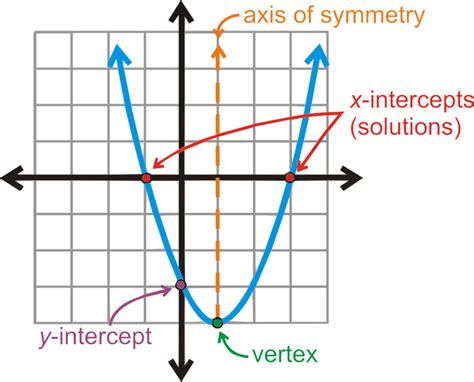
Table of Contents
The Graph of a Quadratic Function is Called a Parabola: A Deep Dive
The graph of a quadratic function, a polynomial function of degree two, is a distinctive and fascinating curve known as a parabola. Understanding parabolas is crucial in various fields, from physics and engineering to computer graphics and economics. This comprehensive guide will explore the properties, characteristics, and applications of parabolas, delving into their mathematical representation and real-world significance.
Defining Quadratic Functions and Parabolas
A quadratic function is a function of the form f(x) = ax² + bx + c, where 'a', 'b', and 'c' are constants, and 'a' is not equal to zero. The 'a', 'b', and 'c' values determine the parabola's shape, orientation, and position on the coordinate plane. The parabola itself is the visual representation of this function – a symmetrical U-shaped curve.
Key Features of a Parabola
Several key features define a parabola:
-
Vertex: The vertex is the parabola's lowest (for a parabola opening upwards) or highest (for a parabola opening downwards) point. It represents the minimum or maximum value of the function. The x-coordinate of the vertex can be found using the formula
x = -b / 2a. The y-coordinate is found by substituting this x-value back into the quadratic function. -
Axis of Symmetry: A vertical line that passes through the vertex and divides the parabola into two mirror-image halves. Its equation is given by
x = -b / 2a. This line of symmetry is crucial for sketching the parabola and understanding its properties. -
x-intercepts (Roots or Zeros): These are the points where the parabola intersects the x-axis (where y = 0). They represent the solutions to the quadratic equation
ax² + bx + c = 0. These can be found using factoring, the quadratic formula, or completing the square. A parabola can have two, one, or no x-intercepts. -
y-intercept: The point where the parabola intersects the y-axis (where x = 0). This is easily found by substituting x = 0 into the quadratic function, yielding the y-intercept at (0, c).
-
Concavity (Opening): The parabola opens upwards (concave up) if 'a' > 0, and it opens downwards (concave down) if 'a' < 0. The value of 'a' also affects the parabola's width; a larger absolute value of 'a' results in a narrower parabola, while a smaller absolute value results in a wider parabola.
Different Forms of Quadratic Equations and Their Impact on Parabola Characteristics
Quadratic functions can be represented in various forms, each highlighting different aspects of the parabola:
1. Standard Form: f(x) = ax² + bx + c
This is the most common form, where 'a', 'b', and 'c' are constants. While it directly shows the y-intercept (c), it doesn't immediately reveal the vertex or axis of symmetry.
2. Vertex Form: f(x) = a(x - h)² + k
This form explicitly displays the vertex (h, k). 'h' represents the x-coordinate of the vertex, and 'k' represents the y-coordinate. The axis of symmetry is x = h. This form simplifies graphing because the vertex is directly identifiable.
3. Factored Form: f(x) = a(x - r₁)(x - r₂)
This form clearly shows the x-intercepts (roots) r₁ and r₂. This is useful for quickly determining where the parabola crosses the x-axis. Note that if the parabola only touches the x-axis at one point (a repeated root), the factored form will have (x-r)²
Graphing Parabolas: A Step-by-Step Guide
Graphing a parabola involves identifying its key features and plotting points:
-
Determine the value of 'a': This indicates whether the parabola opens upwards or downwards.
-
Find the vertex: Use the formula
x = -b / 2ato find the x-coordinate, and substitute this value back into the equation to find the y-coordinate. -
Determine the axis of symmetry: This is the vertical line
x = -b / 2a, passing through the vertex. -
Find the y-intercept: This is the point (0, c).
-
Find the x-intercepts (if any): Solve the quadratic equation
ax² + bx + c = 0using factoring, the quadratic formula, or completing the square. -
Plot the points: Plot the vertex, y-intercept, x-intercepts (if any), and a few additional points to define the curve's shape.
-
Sketch the parabola: Draw a smooth, symmetrical U-shaped curve through the plotted points.
Applications of Parabolas in Real-World Scenarios
Parabolas are not just abstract mathematical concepts; they appear in various real-world phenomena and applications:
1. Physics: Projectile Motion
The path of a projectile (like a ball thrown in the air) follows a parabolic trajectory. Gravity's influence creates the characteristic curved path.
2. Engineering: Antenna Design and Satellite Dishes
Parabolic reflectors are used in satellite dishes and radio telescopes to focus signals onto a receiver at the focal point of the parabola. This design maximizes signal reception.
3. Architecture: Bridge Design and Suspension Bridges
Parabolic arches are used in bridge design because their shape efficiently distributes weight and stress. The cable of a suspension bridge often hangs in a parabolic curve.
4. Optics: Lenses and Mirrors
Parabolic mirrors and lenses are employed in optical systems to focus or collimate light. The parabolic shape ensures accurate reflection or refraction.
5. Computer Graphics: Curve Modeling and Animation
Parabolas and other quadratic curves are used extensively in computer graphics to create smooth, realistic curves and shapes in animation and modeling.
6. Economics: Quadratic Cost and Revenue Functions
In economics, quadratic functions are used to model cost and revenue functions, helping businesses optimize production and pricing strategies. The vertex of the parabola represents the point of maximum profit or minimum cost.
Exploring More Advanced Concepts Related to Parabolas
Beyond the basics, several advanced concepts further enrich the understanding of parabolas:
1. Focus and Directrix
Every parabola has a focus (a point) and a directrix (a line). The parabola is defined as the set of all points equidistant from the focus and the directrix. This geometric definition provides an alternative way to define and understand parabolas.
2. Lattices and Conics
Parabolas are one type of conic section, which are curves formed by the intersection of a plane and a cone. Other conic sections include ellipses and hyperbolas. The study of conics involves examining their various properties and relationships.
3. Parametric Equations
Parabolas can also be represented using parametric equations, which express the x and y coordinates as functions of a parameter, usually 't'. This representation can be helpful for describing the movement of a point along the parabola.
Conclusion: The Ubiquitous Parabola
The graph of a quadratic function, the parabola, is a fundamental geometric shape with widespread applications in various disciplines. Understanding its properties, equations, and graphing techniques is crucial for anyone working with mathematics, physics, engineering, or computer graphics. Its symmetrical nature, defined vertex, and easily identifiable intercepts make it a readily accessible and highly useful mathematical concept with far-reaching implications across numerous fields. From modeling projectile motion to designing satellite dishes, parabolas play an essential role in the way we understand and interact with the world around us. Further exploration of its advanced properties will deepen your comprehension of this ubiquitous and remarkable curve.
Latest Posts
Latest Posts
-
What Is 350 F In Celsius
Mar 15, 2025
-
How Can Igneous Rock Become Metamorphic Rock
Mar 15, 2025
-
X 4 2x 2 8 0
Mar 15, 2025
-
Whats The Square Root Of 28
Mar 15, 2025
-
Where Is The Most Mass Of An Atom Found
Mar 15, 2025
Related Post
Thank you for visiting our website which covers about The Graph Of A Quadratic Function Is Called . We hope the information provided has been useful to you. Feel free to contact us if you have any questions or need further assistance. See you next time and don't miss to bookmark.
