How To Graph 3x Y 6
listenit
Mar 25, 2025 · 5 min read
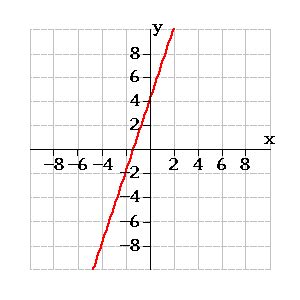
Table of Contents
How to Graph 3x + y = 6: A Comprehensive Guide
Graphing linear equations is a fundamental skill in algebra. This comprehensive guide will walk you through the process of graphing the equation 3x + y = 6, exploring multiple methods and providing a deeper understanding of the underlying concepts. We'll cover everything from finding intercepts to utilizing slope-intercept form, ensuring you master this essential mathematical technique.
Understanding the Equation: 3x + y = 6
Before we dive into graphing, let's understand the equation itself. 3x + y = 6 is a linear equation because it represents a straight line when graphed. It's written in standard form, Ax + By = C, where A, B, and C are constants. In this case, A = 3, B = 1, and C = 6.
Method 1: Finding the x-intercept and y-intercept
One of the simplest methods to graph a linear equation is by finding its intercepts.
Finding the x-intercept
The x-intercept is the point where the line crosses the x-axis. At this point, the y-coordinate is always 0. To find the x-intercept, substitute y = 0 into the equation and solve for x:
3x + 0 = 6 3x = 6 x = 2
Therefore, the x-intercept is (2, 0).
Finding the y-intercept
The y-intercept is the point where the line crosses the y-axis. At this point, the x-coordinate is always 0. To find the y-intercept, substitute x = 0 into the equation and solve for y:
3(0) + y = 6 y = 6
Therefore, the y-intercept is (0, 6).
Plotting the Intercepts and Drawing the Line
Now that we have the x-intercept (2, 0) and the y-intercept (0, 6), we can plot these points on a coordinate plane. Draw a straight line passing through these two points. This line represents the graph of the equation 3x + y = 6.
Method 2: Using the Slope-Intercept Form (y = mx + b)
The slope-intercept form, y = mx + b, provides another way to graph the equation. 'm' represents the slope of the line, and 'b' represents the y-intercept.
Converting to Slope-Intercept Form
To convert 3x + y = 6 into slope-intercept form, we need to solve for y:
3x + y = 6 y = -3x + 6
Now we can identify the slope and y-intercept:
- Slope (m) = -3: This indicates that for every 1 unit increase in x, y decreases by 3 units. The negative slope signifies a downward-sloping line.
- y-intercept (b) = 6: This confirms our earlier finding that the line crosses the y-axis at (0, 6).
Plotting the y-intercept and using the slope to find another point
Start by plotting the y-intercept (0, 6). Then, use the slope to find another point on the line. Since the slope is -3, we can move 1 unit to the right and 3 units down from the y-intercept. This gives us the point (1, 3). Plot this point and draw a straight line through both points. This line will be identical to the one obtained using the intercept method.
Method 3: Creating a Table of Values
This method involves creating a table of x and y values that satisfy the equation. Choose several values for x, substitute them into the equation, and solve for the corresponding y values.
| x | y = -3x + 6 | (x, y) |
|---|---|---|
| -1 | 9 | (-1, 9) |
| 0 | 6 | (0, 6) |
| 1 | 3 | (1, 3) |
| 2 | 0 | (2, 0) |
| 3 | -3 | (3, -3) |
Plot these points on a coordinate plane and draw a straight line connecting them. Again, this line will be the same as the ones obtained using the previous methods.
Understanding the Slope and its Significance
The slope (-3 in this case) is a crucial characteristic of a linear equation. It represents the rate of change of y with respect to x. A negative slope means the line is decreasing as x increases. A positive slope would indicate an increasing line. A slope of 0 means the line is horizontal. An undefined slope indicates a vertical line.
Understanding the slope allows you to predict the behavior of the line and interpret its meaning in real-world applications. For instance, if this equation represented the relationship between the number of hours worked (x) and the amount of money earned (y), a slope of -3 would be unusual (unless it's showing deductions or something similar). However, it's important to know the meaning of the slope within the context of the problem.
Extending Understanding: Parallel and Perpendicular Lines
The concept of slope is crucial when dealing with parallel and perpendicular lines.
-
Parallel Lines: Parallel lines have the same slope. Any line parallel to 3x + y = 6 will also have a slope of -3.
-
Perpendicular Lines: Perpendicular lines have slopes that are negative reciprocals of each other. The negative reciprocal of -3 is 1/3. Any line perpendicular to 3x + y = 6 will have a slope of 1/3.
Real-World Applications
Linear equations like 3x + y = 6 have numerous real-world applications:
- Economics: Modeling supply and demand curves.
- Physics: Representing relationships between distance, speed, and time.
- Engineering: Describing linear relationships in various systems.
- Finance: Calculating simple interest.
Troubleshooting Common Mistakes
- Incorrectly solving for y: Ensure you accurately solve the equation for y when converting to slope-intercept form.
- Misinterpreting the slope: Pay close attention to the sign of the slope to determine whether the line is increasing or decreasing.
- Plotting points incorrectly: Double-check the coordinates of the points you plot on the graph.
Advanced Concepts and Further Exploration
This guide provided a solid foundation for graphing linear equations. To further enhance your understanding, explore:
- Systems of linear equations: Learn how to solve for the intersection point of two or more lines.
- Linear inequalities: Graphing inequalities involves shading regions on the coordinate plane.
- Non-linear equations: Expand your graphing skills to include curves and other shapes.
By mastering the techniques outlined in this guide, you'll develop a strong foundation in graphing linear equations, enabling you to tackle more complex mathematical problems and confidently apply these skills in various contexts. Remember to practice regularly and explore different approaches to solidify your understanding. The ability to visualize and interpret linear relationships is crucial in many fields, making this skill a valuable asset in your mathematical toolkit. Keep practicing, and you’ll become proficient in graphing linear equations in no time!
Latest Posts
Latest Posts
-
Where Is Most Of Earths Freshwater Stored
Mar 27, 2025
-
How Many Protons Does Strontium Have
Mar 27, 2025
-
Is The Earth Older Than The Sun
Mar 27, 2025
-
What Is The Trend Of Atomic Radii
Mar 27, 2025
-
28 9 As A Mixed Number
Mar 27, 2025
Related Post
Thank you for visiting our website which covers about How To Graph 3x Y 6 . We hope the information provided has been useful to you. Feel free to contact us if you have any questions or need further assistance. See you next time and don't miss to bookmark.
