How To Calculate The Point Estimate
listenit
Mar 27, 2025 · 6 min read
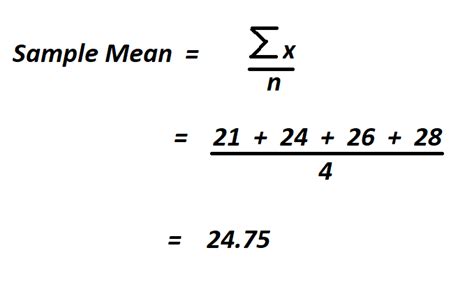
Table of Contents
How to Calculate the Point Estimate: A Comprehensive Guide
Point estimation is a crucial concept in statistics, forming the bedrock of many inferential procedures. It involves using sample data to produce a single value that serves as the "best guess" for an unknown population parameter. Understanding how to calculate point estimates is essential for anyone working with data analysis, from researchers and analysts to students and enthusiasts. This comprehensive guide will walk you through various methods, providing clear explanations and examples to solidify your understanding.
What is a Point Estimate?
A point estimate is a single value derived from sample data that represents the best guess for a population parameter. This parameter could be anything from the population mean (average) or proportion (percentage) to the population standard deviation or variance. The goal is to use the information from a representative sample to make an informed inference about the larger population.
Key Concepts to Understand Before Calculating Point Estimates
Before diving into the calculations, let's clarify some fundamental statistical concepts:
1. Population vs. Sample:
- Population: The entire group you're interested in studying (e.g., all registered voters in a country, all oak trees in a forest). Often, studying the entire population is impractical or impossible due to cost, time, or accessibility.
- Sample: A subset of the population selected for study. A well-chosen sample should accurately represent the characteristics of the larger population.
2. Population Parameters vs. Sample Statistics:
- Population Parameters: Numerical characteristics that describe the population (e.g., population mean (μ), population standard deviation (σ), population proportion (P)). These are often unknown and what we are trying to estimate.
- Sample Statistics: Numerical characteristics calculated from the sample data (e.g., sample mean (x̄), sample standard deviation (s), sample proportion (p̂)). These are used to estimate the corresponding population parameters.
3. Estimators:
An estimator is a statistic used to estimate a population parameter. A good estimator should be:
- Unbiased: The expected value of the estimator should be equal to the population parameter. This means that over many samples, the average of the estimator's values will be close to the true population parameter.
- Efficient: The estimator should have a relatively small variance, meaning its estimates are clustered tightly around the true population parameter.
- Consistent: As the sample size increases, the estimator should converge towards the true population parameter.
Common Point Estimates and Their Calculations
Let's explore the most frequently used point estimates and how to calculate them:
1. Estimating the Population Mean (μ)
The most common point estimate for the population mean (μ) is the sample mean (x̄).
Formula:
x̄ = Σxᵢ / n
Where:
- xᵢ represents each individual data point in the sample.
- n is the sample size.
- Σ denotes the sum of all data points.
Example:
Suppose you have a sample of five exam scores: 85, 92, 78, 88, and 90. The sample mean would be:
x̄ = (85 + 92 + 78 + 88 + 90) / 5 = 86.6
Therefore, the point estimate for the population mean exam score is 86.6.
2. Estimating the Population Proportion (P)
The point estimate for the population proportion (P) is the sample proportion (p̂).
Formula:
p̂ = x / n
Where:
- x is the number of successes (individuals possessing the characteristic of interest) in the sample.
- n is the sample size.
Example:
In a survey of 100 people, 60 indicated they prefer coffee over tea. The sample proportion of coffee drinkers is:
p̂ = 60 / 100 = 0.6 or 60%
Therefore, the point estimate for the population proportion of coffee drinkers is 0.6.
3. Estimating the Population Variance (σ²) and Standard Deviation (σ)
The point estimates for the population variance (σ²) and standard deviation (σ) are the sample variance (s²) and sample standard deviation (s), respectively. However, it's crucial to understand that the sample variance is a biased estimator of the population variance; it consistently underestimates the population variance, especially for smaller sample sizes. To correct for this bias, we use a slightly modified formula for the sample variance:
Formula for Sample Variance (s²):
s² = Σ(xᵢ - x̄)² / (n - 1)
Formula for Sample Standard Deviation (s):
s = √s²
Example:
Using the same exam score data (85, 92, 78, 88, 90), let's calculate the sample variance and standard deviation:
- Calculate the mean (x̄): 86.6 (as calculated previously)
- Calculate the deviations from the mean: (85-86.6), (92-86.6), (78-86.6), (88-86.6), (90-86.6) = -1.6, 5.4, -8.6, 1.4, 3.4
- Square the deviations: 2.56, 29.16, 73.96, 1.96, 11.56
- Sum the squared deviations: 2.56 + 29.16 + 73.96 + 1.96 + 11.56 = 119.2
- Divide by (n-1): 119.2 / (5-1) = 29.8
- Sample variance (s²): 29.8
- Sample standard deviation (s): √29.8 ≈ 5.46
Therefore, the point estimates for the population variance and standard deviation are 29.8 and 5.46, respectively. Remember that the sample variance is a slightly biased estimator of the population variance. Using (n-1) instead of n in the denominator helps to correct for this bias.
Choosing the Right Point Estimate
The choice of point estimate depends on the specific population parameter you're trying to estimate and the nature of your data. Always consider the properties of the estimator (unbiasedness, efficiency, consistency) when selecting the appropriate method.
Interpreting Point Estimates and Understanding Their Limitations
Point estimates provide a concise summary of the sample data, offering a single value as the best guess for the population parameter. However, it's crucial to remember that point estimates are just estimates. They are subject to sampling variability; different samples from the same population will produce different point estimates. Therefore, it's generally recommended to accompany point estimates with measures of uncertainty, such as confidence intervals, to provide a more complete picture of the population parameter.
Advanced Point Estimation Techniques
Beyond the basic methods described above, more sophisticated point estimation techniques exist for various statistical models and scenarios. These might include:
- Maximum Likelihood Estimation (MLE): A powerful method that finds the parameter values that maximize the likelihood of observing the sample data.
- Method of Moments: This method equates sample moments (e.g., sample mean, sample variance) to their corresponding population moments to estimate parameters.
- Bayesian Estimation: This approach incorporates prior knowledge about the parameters along with the sample data to obtain posterior estimates.
These advanced techniques often require more complex calculations and a deeper understanding of statistical theory.
Conclusion
Calculating point estimates is a fundamental skill in statistics. Understanding how to calculate and interpret these estimates, along with their limitations, is crucial for anyone working with data. Remember to choose the appropriate point estimate based on the population parameter of interest and always consider using confidence intervals to quantify the uncertainty associated with your estimate. By mastering point estimation, you'll significantly improve your ability to draw meaningful conclusions from data and make informed decisions based on statistical evidence. Continuous practice and exploration of different datasets will further enhance your understanding and proficiency in this essential area of statistical analysis.
Latest Posts
Latest Posts
-
What Is 39 6 Celsius In Fahrenheit
Mar 30, 2025
-
44 Is 55 Of What Number
Mar 30, 2025
-
How Does Price Discrimination Benefit Producers And Consumers
Mar 30, 2025
-
Which Element Is The Most Metallic
Mar 30, 2025
-
Do Srtrong Bases Completely Dissociate In Water
Mar 30, 2025
Related Post
Thank you for visiting our website which covers about How To Calculate The Point Estimate . We hope the information provided has been useful to you. Feel free to contact us if you have any questions or need further assistance. See you next time and don't miss to bookmark.
