How Do You Find The Phenotype Ratio
listenit
Mar 22, 2025 · 6 min read
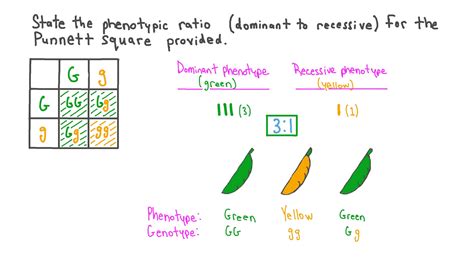
Table of Contents
How to Find the Phenotype Ratio: A Comprehensive Guide
Understanding phenotype ratios is crucial in genetics. This guide will walk you through the process, from basic Mendelian genetics to more complex scenarios involving multiple genes and non-Mendelian inheritance patterns. We'll explore different methods, including Punnett squares, forked-line diagrams, and the binomial theorem, equipping you with the tools to accurately predict phenotype ratios in various genetic crosses.
What is a Phenotype Ratio?
A phenotype ratio describes the proportion of different observable physical traits (phenotypes) in the offspring resulting from a genetic cross. It's expressed as a ratio, for example, 3:1, 9:3:3:1, etc. These ratios represent the predicted outcome based on the parental genotypes and the inheritance pattern of the genes involved. It's essential to differentiate this from a genotype ratio, which describes the proportions of different genetic makeups (genotypes) among the offspring.
Mendelian Inheritance: The Foundation
Gregor Mendel's work laid the foundation for understanding inheritance patterns. His experiments with pea plants revealed the principles of segregation and independent assortment, which are fundamental to predicting phenotype ratios in simple crosses.
Monohybrid Crosses: One Gene at a Time
A monohybrid cross involves tracking the inheritance of a single gene with two alleles (variants of the gene). Let's consider a classic example: flower color in pea plants. Let's say 'P' represents the dominant allele for purple flowers and 'p' represents the recessive allele for white flowers.
- Parental generation (P): PP (purple) x pp (white)
- F1 generation: All offspring will be Pp (purple) - the dominant allele masks the recessive one.
- F2 generation (F1 x F1): Pp x Pp. This is where we use a Punnett square to determine the genotype and phenotype ratios.
| P | p | |
|---|---|---|
| P | PP | Pp |
| p | Pp | pp |
Genotype Ratio: 1 PP : 2 Pp : 1 pp Phenotype Ratio: 3 Purple : 1 White
This 3:1 phenotype ratio is characteristic of a monohybrid cross involving a single gene with complete dominance.
Dihybrid Crosses: Two Genes at a Play
Dihybrid crosses involve tracking the inheritance of two different genes simultaneously. Let's consider pea plant shape and color. 'R' represents round seeds (dominant), 'r' represents wrinkled seeds (recessive), 'Y' represents yellow seeds (dominant), and 'y' represents green seeds (recessive).
- Parental generation (P): RRYY (round, yellow) x rryy (wrinkled, green)
- F1 generation: All offspring will be RrYy (round, yellow).
- F2 generation (F1 x F1): RrYy x RrYy. A 4x4 Punnett square is needed here, which can become cumbersome. Let's use the forked-line method.
Forked-Line Method:
This method simplifies the process for dihybrid crosses and beyond. We consider each gene separately.
- Gene 1 (Shape): Rr x Rr → 3 Round : 1 Wrinkled (RR, Rr, Rr, rr)
- Gene 2 (Color): Yy x Yy → 3 Yellow : 1 Green (YY, Yy, Yy, yy)
To find the dihybrid phenotype ratio, we multiply the individual ratios:
(3 Round : 1 Wrinkled) x (3 Yellow : 1 Green) = 9 Round Yellow : 3 Round Green : 3 Wrinkled Yellow : 1 Wrinkled Green
This 9:3:3:1 ratio is the classic dihybrid phenotype ratio for two genes with independent assortment and complete dominance.
Beyond Mendelian Genetics: More Complex Scenarios
Not all inheritance patterns follow Mendel's simple rules. Several factors can complicate phenotype ratio predictions.
Incomplete Dominance
In incomplete dominance, neither allele is completely dominant. The heterozygote displays an intermediate phenotype. For example, if 'R' represents red flowers and 'r' represents white flowers, Rr might produce pink flowers. The F2 generation phenotype ratio for incomplete dominance is 1:2:1 (Red:Pink:White).
Codominance
In codominance, both alleles are expressed equally in the heterozygote. A classic example is ABO blood type, where alleles IA and IB are both expressed in individuals with type AB blood.
Multiple Alleles
Some genes have more than two alleles. The ABO blood group system is a prime example, with three alleles (IA, IB, i) resulting in four blood types (A, B, AB, O). The phenotype ratios in these cases depend on the allele frequencies and dominance relationships.
Epistasis
Epistasis occurs when the expression of one gene affects the expression of another. One gene can mask or modify the phenotype produced by a different gene. This leads to deviations from expected Mendelian ratios.
Pleiotropy
Pleiotropy is when a single gene affects multiple phenotypic traits. This can make it difficult to predict simple phenotype ratios, as the effects on different traits might be interconnected.
Sex-Linked Inheritance
Genes located on sex chromosomes (X and Y) show different inheritance patterns than autosomal genes. Sex-linked traits often exhibit skewed phenotype ratios in males and females due to the difference in the number of X chromosomes.
Environmental Influences
The environment can also significantly impact phenotype expression. Factors like temperature, nutrition, and light can alter the manifestation of a genotype, leading to variations in observed phenotype ratios.
Advanced Techniques: Probability and Statistics
For more complex crosses involving multiple genes or non-Mendelian inheritance, using probability calculations can be more efficient than Punnett squares or forked-line diagrams.
The Binomial Theorem
The binomial theorem is a powerful tool for calculating the probability of specific combinations of phenotypes in crosses involving multiple genes. The formula is:
(p + q)^n
where:
- 'p' is the probability of one phenotype
- 'q' is the probability of the alternative phenotype
- 'n' is the number of offspring
This theorem helps to predict the probability of specific combinations of phenotypes in large sample sizes, providing a more accurate representation of expected phenotype ratios.
Chi-Square Test
Once you've predicted phenotype ratios, you can compare these predictions to actual experimental results using statistical tests like the chi-square test. This test helps to determine if the observed deviations from the expected ratios are due to chance or if there are other factors influencing the inheritance patterns.
Conclusion
Determining phenotype ratios is a fundamental skill in genetics. While Mendelian genetics provides a solid foundation, understanding the complexities of non-Mendelian inheritance is crucial for accurate predictions. By mastering Punnett squares, forked-line diagrams, and probabilistic methods, you can effectively analyze genetic crosses, interpret experimental results, and gain a deeper understanding of the intricate relationship between genotype and phenotype. Remember to always consider factors like incomplete dominance, codominance, multiple alleles, epistasis, pleiotropy, sex linkage, and environmental effects when analyzing inheritance patterns and predicting phenotype ratios. Utilizing statistical tools like the chi-square test allows you to assess the validity of your genetic models against actual experimental data. This comprehensive approach will ensure a more accurate and nuanced understanding of the fascinating world of genetics.
Latest Posts
Latest Posts
-
What Is 2 And 1 3 As An Improper Fraction
Mar 23, 2025
-
Balance The Equation C2h6 O2 Co2 H2o
Mar 23, 2025
-
How Many Centimeters Is 4 Meters
Mar 23, 2025
-
How Many Valence Electrons Does Sulfer Have
Mar 23, 2025
-
What Is 70 Percent Of 45
Mar 23, 2025
Related Post
Thank you for visiting our website which covers about How Do You Find The Phenotype Ratio . We hope the information provided has been useful to you. Feel free to contact us if you have any questions or need further assistance. See you next time and don't miss to bookmark.
