Graph The Parabola Y 3x 2
listenit
Mar 22, 2025 · 5 min read
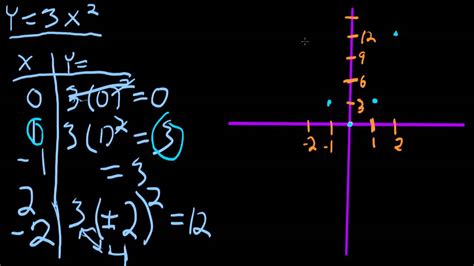
Table of Contents
Graphing the Parabola y = 3x²: A Comprehensive Guide
Graphing parabolas is a fundamental concept in algebra and pre-calculus. Understanding how to graph parabolas, especially simple ones like y = 3x², is crucial for tackling more complex mathematical problems. This comprehensive guide will walk you through the process of graphing y = 3x², exploring key characteristics, methods, and applications. We'll delve into the concept of parabolas, their equations, and how to effectively represent them visually.
Understanding the Parabola
A parabola is a U-shaped curve that is symmetric about a line called its axis of symmetry. The equation of a parabola in its standard form is usually represented as y = ax² + bx + c, where 'a', 'b', and 'c' are constants. In our case, y = 3x², we have a = 3, b = 0, and c = 0. The value of 'a' dictates several important features of the parabola:
-
Shape and Orientation: If 'a' is positive (like in our example), the parabola opens upwards. If 'a' is negative, it opens downwards. A larger absolute value of 'a' indicates a narrower parabola; a smaller absolute value results in a wider parabola.
-
Vertex: The vertex is the lowest (for upward-opening parabolas) or highest (for downward-opening parabolas) point on the parabola. For parabolas in the form y = ax², the vertex is always at the origin (0,0).
-
Axis of Symmetry: This is a vertical line that divides the parabola into two mirror images. For parabolas in the form y = ax², the axis of symmetry is always the y-axis (x = 0).
Graphing y = 3x²: Step-by-Step
Let's break down the process of graphing y = 3x²:
1. Identify Key Characteristics:
- Opens Upward: Since a = 3 (positive), the parabola opens upwards.
- Vertex at (0, 0): The vertex is at the origin because the equation is in the simplest form, y = ax².
- Axis of Symmetry: x = 0: The y-axis serves as the axis of symmetry.
- Narrower than y = x²: Because |3| > |1|, the parabola will be narrower than the basic parabola y = x².
2. Create a Table of Values:
To accurately plot the parabola, we need to find several points that lie on the curve. We can do this by substituting different x-values into the equation y = 3x² and calculating the corresponding y-values. Let's create a table:
| x | y = 3x² | (x, y) |
|---|---|---|
| -2 | 12 | (-2, 12) |
| -1 | 3 | (-1, 3) |
| 0 | 0 | (0, 0) |
| 1 | 3 | (1, 3) |
| 2 | 12 | (2, 12) |
You can choose more x-values to get a more detailed graph, especially around the vertex. For instance, you could include x = -1.5, -0.5, 0.5, and 1.5 for a smoother curve.
3. Plot the Points and Draw the Parabola:
Using the table of values, plot the points on a coordinate plane. Remember that the parabola is symmetric about the y-axis (x = 0), so you only need to calculate the y-values for positive x-values and then mirror them for the negative x-values. Once you have plotted several points, connect them with a smooth, U-shaped curve. Ensure your curve is symmetric about the y-axis.
4. Label the Graph:
Clearly label the axes (x and y), the vertex (0,0), the axis of symmetry (x=0), and the equation of the parabola (y = 3x²). Adding a title, such as "Graph of y = 3x²", enhances clarity.
Advanced Concepts and Applications
Understanding the basics of graphing y = 3x² provides a foundation for exploring more complex scenarios:
Transformations of Parabolas
The equation y = 3x² can be modified to create various transformations:
-
Vertical Shifts: Adding or subtracting a constant from the equation shifts the parabola vertically. For example, y = 3x² + 2 shifts the parabola 2 units upwards. y = 3x² - 5 shifts it 5 units downwards.
-
Horizontal Shifts: Adding or subtracting a constant inside the parentheses shifts the parabola horizontally. For example, y = 3(x - 2)² shifts the parabola 2 units to the right. y = 3(x + 1)² shifts it 1 unit to the left.
-
Vertical Stretches and Compressions: Multiplying the entire equation by a constant greater than 1 stretches the parabola vertically, making it narrower. Multiplying by a constant between 0 and 1 compresses it vertically, making it wider. We already saw this with the factor of 3 in our original equation.
-
Reflections: A negative sign in front of the x² term reflects the parabola across the x-axis, making it open downwards. For example, y = -3x² reflects our original parabola.
Quadratic Equations and their Graphs
The graph of a quadratic equation, like y = 3x², provides valuable information:
-
Roots (or x-intercepts): The points where the parabola intersects the x-axis are called the roots or zeros of the equation. For y = 3x², the only root is at x = 0.
-
y-intercept: The point where the parabola intersects the y-axis. For y = 3x², the y-intercept is at y = 0.
-
Maximum or Minimum Value: The y-coordinate of the vertex represents the minimum or maximum value of the quadratic function. In our case, the minimum value is 0.
Real-World Applications
Parabolas appear in numerous real-world scenarios:
-
Projectile Motion: The path of a projectile, such as a ball thrown in the air, follows a parabolic trajectory. The equation describing the motion incorporates gravity and initial velocity.
-
Architectural Design: Parabolic arches are used in bridges and buildings due to their strength and efficiency.
-
Satellite Dishes: The shape of a satellite dish is a parabola, designed to focus incoming signals at a single point.
-
Headlights and Reflectors: Parabolic reflectors are used in headlights and flashlights to focus light into a beam.
Conclusion
Graphing the parabola y = 3x² is a fundamental skill in mathematics with wide-ranging applications. By understanding the characteristics of parabolas, utilizing tables of values, and recognizing the impact of transformations, you can effectively graph these curves and apply this knowledge to solve real-world problems involving quadratic functions. Remember to practice regularly to solidify your understanding and enhance your ability to tackle increasingly complex mathematical concepts. This comprehensive guide has provided a solid foundation – continue exploring the world of parabolas and their fascinating properties!
Latest Posts
Latest Posts
-
Is Corrosion A Physical Or Chemical Property
Mar 23, 2025
-
What Is 0 02 As A Fraction
Mar 23, 2025
-
2 5 As A Percentage And Decimal
Mar 23, 2025
-
In What Organelle Does Photosynthesis Take Place
Mar 23, 2025
-
How Is More Food Increase Carrying Capacity
Mar 23, 2025
Related Post
Thank you for visiting our website which covers about Graph The Parabola Y 3x 2 . We hope the information provided has been useful to you. Feel free to contact us if you have any questions or need further assistance. See you next time and don't miss to bookmark.
