Assume The Random Variable X Is Normally Distributed With Mean
listenit
Mar 28, 2025 · 6 min read
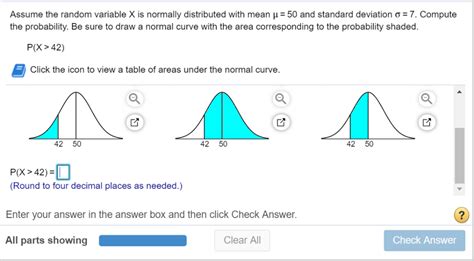
Table of Contents
Assume the Random Variable X is Normally Distributed with Mean: A Comprehensive Guide
The normal distribution, also known as the Gaussian distribution, is a fundamental concept in statistics and probability. Its bell-shaped curve is ubiquitous, appearing in countless applications across various fields, from finance and engineering to medicine and social sciences. Understanding the properties of a normally distributed random variable, denoted as X ~ N(μ, σ²), where μ represents the mean and σ² the variance, is crucial for numerous statistical analyses. This article provides a comprehensive exploration of this crucial concept, delving into its properties, applications, and related statistical tests.
Understanding the Normal Distribution
The normal distribution is characterized by its two parameters: the mean (μ) and the standard deviation (σ). The mean represents the average value of the distribution, while the standard deviation measures the spread or dispersion of the data around the mean. A larger standard deviation indicates a wider spread, while a smaller standard deviation suggests data clustered tightly around the mean.
Key Properties of the Normal Distribution:
- Symmetrical: The normal distribution is perfectly symmetrical around its mean. This means that the probability of observing a value below the mean is equal to the probability of observing a value above the mean.
- Unimodal: It has a single peak, located at the mean. This signifies that the most frequent values are centered around the mean.
- Defined by Mean and Standard Deviation: The entire distribution is completely defined by its mean and standard deviation. Knowing these two parameters allows us to calculate probabilities for any range of values.
- Empirical Rule (68-95-99.7 Rule): Approximately 68% of the data falls within one standard deviation of the mean, 95% within two standard deviations, and 99.7% within three standard deviations. This rule provides a quick way to estimate probabilities.
- Infinite Range: The normal distribution theoretically extends infinitely in both directions, although the probability density rapidly approaches zero as we move far from the mean.
Standard Normal Distribution (Z-distribution)
A special case of the normal distribution is the standard normal distribution, also known as the Z-distribution. It has a mean of 0 and a standard deviation of 1. Any normally distributed variable X can be transformed into a standard normal variable Z using the following formula:
Z = (X - μ) / σ
This transformation is incredibly useful because it allows us to use standard normal tables (or statistical software) to calculate probabilities for any normally distributed variable, regardless of its mean and standard deviation. These tables provide the cumulative probability (area under the curve) to the left of a given Z-score.
Calculating Probabilities using the Z-score
Let's illustrate how to calculate probabilities using the Z-score. Suppose X ~ N(50, 10²) and we want to find the probability that X is less than 65. First, we calculate the Z-score:
Z = (65 - 50) / 10 = 1.5
Now, we consult a standard normal table or use statistical software to find the probability that Z is less than 1.5. This probability is approximately 0.9332. Therefore, the probability that X is less than 65 is approximately 0.9332.
Applications of the Normal Distribution
The normal distribution has a vast range of applications across diverse fields. Here are a few prominent examples:
1. Statistical Inference
The normal distribution plays a critical role in statistical inference, forming the foundation for many hypothesis tests and confidence intervals. For example, the t-test, a common test for comparing means, relies on the assumption of normality (or a large sample size). Similarly, confidence intervals for population means are often based on the normal distribution.
2. Quality Control
In quality control, the normal distribution is used to monitor and control the quality of products. By assuming that the measurements of a certain characteristic follow a normal distribution, manufacturers can establish control limits and detect deviations from desired specifications.
3. Finance
The normal distribution is often used to model the returns of financial assets, although it's important to note that real-world financial data often exhibits heavier tails than a normal distribution would predict. Despite this, the normal distribution provides a useful approximation for many financial modeling tasks.
4. Medicine
In medicine, the normal distribution is used to model various biological measurements, such as height, weight, and blood pressure. This allows researchers to establish norms and identify individuals who fall outside the typical range.
5. Engineering
Engineers utilize the normal distribution for various tasks, including tolerance analysis, reliability analysis, and process capability analysis. Understanding the distribution of component dimensions helps ensure product functionality and performance.
Central Limit Theorem
The central limit theorem (CLT) is a cornerstone of statistical theory. It states that the distribution of the sample mean of a sufficiently large number of independent and identically distributed random variables (regardless of their original distribution) will be approximately normally distributed, regardless of the shape of the original population distribution. This is a powerful result because it allows us to make inferences about population means even when the population distribution is unknown.
The CLT's significance lies in its ability to justify the use of normal distribution-based methods for statistical inference even when the underlying data doesn't perfectly conform to a normal distribution. As the sample size increases, the approximation becomes more accurate.
Departures from Normality
While the normal distribution is a powerful tool, it's essential to recognize that not all data follows a normal distribution. Data may exhibit:
- Skewness: A skewed distribution is asymmetric, with a longer tail on one side than the other. Positive skewness indicates a longer tail on the right, while negative skewness indicates a longer tail on the left.
- Kurtosis: Kurtosis measures the "tailedness" and "peakedness" of a distribution. Leptokurtic distributions are more peaked and have heavier tails than a normal distribution, while platykurtic distributions are flatter and have lighter tails.
- Multimodality: A multimodal distribution has multiple peaks, indicating the presence of distinct subgroups within the data.
When data significantly deviates from normality, alternative statistical methods might be more appropriate, such as non-parametric methods.
Testing for Normality
Several statistical tests can assess whether a dataset is likely to have been drawn from a normally distributed population. These include:
- Shapiro-Wilk Test: A powerful test for normality, particularly effective for smaller sample sizes.
- Kolmogorov-Smirnov Test: Another commonly used test for normality, applicable to both small and large samples.
- Anderson-Darling Test: A modification of the Kolmogorov-Smirnov test, often considered more sensitive to departures from normality in the tails of the distribution.
- Q-Q Plots (Quantile-Quantile Plots): Visual tools that compare the quantiles of a dataset to the quantiles of a normal distribution. If the data is normally distributed, the points on the Q-Q plot should fall approximately along a straight line.
These tests provide a statistical measure of how likely it is that the data comes from a normal distribution. However, it's important to remember that these tests don't definitively prove or disprove normality; rather, they provide evidence to support or refute the assumption of normality.
Conclusion
The normal distribution is a cornerstone of statistics and probability. Its properties, applications, and relationship to the central limit theorem make it an indispensable tool for analyzing data and making inferences about populations. While not all data perfectly follows a normal distribution, understanding its characteristics and the methods for assessing normality are crucial for effective statistical analysis across a wide range of disciplines. Remember to always consider the nature of your data and choose the appropriate statistical methods accordingly. The use of statistical software packages will significantly aid in calculations and visualizing the data to determine its adherence to the normal distribution. Understanding the limitations and applications of the normal distribution is key to conducting robust and meaningful statistical analyses.
Latest Posts
Latest Posts
-
How Are Pressure And Temp Related
Mar 31, 2025
-
What Is 2 4 In A Fraction
Mar 31, 2025
-
Organisms That Cannot Make Their Own Food
Mar 31, 2025
-
How Many Electrons Are In The 4th Energy Level
Mar 31, 2025
-
How To Convert Molarity To Molality
Mar 31, 2025
Related Post
Thank you for visiting our website which covers about Assume The Random Variable X Is Normally Distributed With Mean . We hope the information provided has been useful to you. Feel free to contact us if you have any questions or need further assistance. See you next time and don't miss to bookmark.
