X 2 6x 9 0 Graph
listenit
Mar 29, 2025 · 5 min read
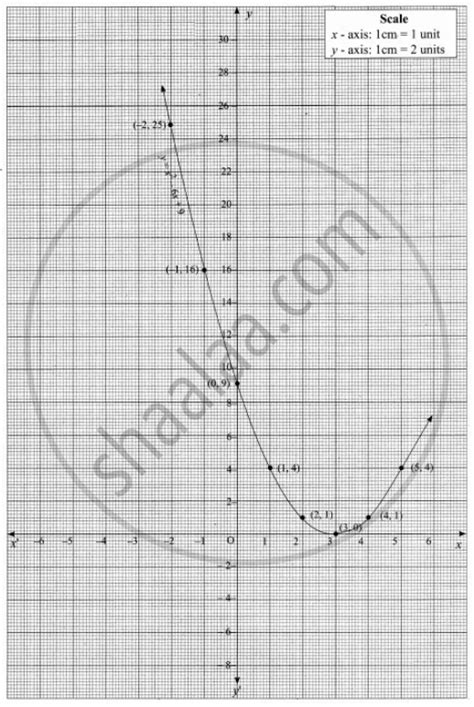
Table of Contents
Understanding the Graph of x² - 6x + 9 = 0: A Comprehensive Guide
The quadratic equation x² - 6x + 9 = 0 represents a parabola, a fundamental concept in algebra and calculus. Understanding its graph provides insights into its roots, vertex, axis of symmetry, and overall behavior. This comprehensive guide will delve into each aspect, providing a detailed analysis and practical applications.
1. Factoring and Finding the Roots
The first step in understanding the graph of x² - 6x + 9 = 0 is to find its roots, also known as the x-intercepts or zeros. These are the points where the parabola intersects the x-axis, meaning the y-value is zero. The equation is a perfect square trinomial, meaning it can be easily factored:
x² - 6x + 9 = (x - 3)(x - 3) = (x - 3)² = 0
This reveals that the equation has a single, repeated root at x = 3. This means the parabola touches the x-axis at only one point. In contrast to quadratic equations with two distinct real roots, where the parabola intersects the x-axis at two separate points, this equation signifies a unique characteristic of its graph.
2. Determining the Vertex
The vertex of a parabola is the point where the curve changes direction – either from decreasing to increasing (for parabolas opening upwards) or from increasing to decreasing (for parabolas opening downwards). For a quadratic equation in the standard form ax² + bx + c = 0, the x-coordinate of the vertex is given by:
x = -b / 2a
In our equation, x² - 6x + 9 = 0, a = 1 and b = -6. Therefore, the x-coordinate of the vertex is:
x = -(-6) / 2(1) = 3
To find the y-coordinate, substitute the x-coordinate back into the original equation:
y = (3)² - 6(3) + 9 = 9 - 18 + 9 = 0
Thus, the vertex of the parabola is (3, 0). This confirms our earlier finding that the parabola touches the x-axis at x = 3.
3. Identifying the Axis of Symmetry
The axis of symmetry is a vertical line that divides the parabola into two mirror-image halves. It always passes through the vertex. For a quadratic equation in the standard form, the equation of the axis of symmetry is:
x = -b / 2a
This is the same formula used to find the x-coordinate of the vertex. Therefore, the axis of symmetry for our equation is:
x = 3
This vertical line, x = 3, perfectly bisects the parabola.
4. Determining the Parabola's Concavity
The parabola's concavity, whether it opens upwards or downwards, is determined by the coefficient of the x² term (a). If a > 0, the parabola opens upwards (concave up), and if a < 0, it opens downwards (concave down).
In our equation, x² - 6x + 9 = 0, a = 1, which is positive. Therefore, the parabola opens upwards. This means the vertex represents the minimum point of the parabola.
5. Sketching the Graph
Now that we have all the necessary information – roots, vertex, axis of symmetry, and concavity – we can sketch the graph.
- Plot the vertex: (3, 0)
- Draw the axis of symmetry: The vertical line x = 3
- Plot additional points: To get a more accurate representation, you can plug in other x-values into the equation and plot the corresponding y-values. For instance:
- If x = 2, y = (2)² - 6(2) + 9 = 1
- If x = 4, y = (4)² - 6(4) + 9 = 1
- If x = 0, y = (0)² - 6(0) + 9 = 9
- If x = 6, y = (6)² - 6(6) + 9 = 9
- Sketch the parabola: Connect the points with a smooth, U-shaped curve, ensuring it is symmetric about the axis of symmetry (x = 3) and opens upwards.
6. Analyzing the Graph's Properties
The graph of x² - 6x + 9 = 0 reveals several key properties:
- Single Root: The parabola touches the x-axis at only one point (x = 3), indicating a repeated root.
- Minimum Point: The vertex (3,0) represents the minimum value of the function.
- Symmetry: The parabola is perfectly symmetrical about the axis of symmetry x = 3.
- Positive Definite: Since the parabola opens upwards and its minimum value is 0, the function is always non-negative (f(x) ≥ 0 for all x).
7. Applications and Real-World Examples
Understanding quadratic graphs like this one has numerous applications in various fields:
- Physics: Modeling projectile motion, where the parabola represents the trajectory of a thrown object. The vertex represents the maximum height.
- Engineering: Designing parabolic antennas or reflectors, which utilize the reflective properties of parabolas to focus signals.
- Economics: Representing cost functions or revenue functions, where the vertex can indicate the minimum cost or maximum revenue.
- Computer Graphics: Creating curved shapes and paths in animations and simulations.
8. Comparing to Other Quadratic Equations
Comparing x² - 6x + 9 = 0 to other quadratic equations helps illustrate the unique characteristics of its graph.
- Equations with two distinct real roots: These parabolas intersect the x-axis at two different points.
- Equations with no real roots: These parabolas do not intersect the x-axis at all, lying entirely above or below it.
- Equations with a vertex not on the x-axis: These parabolas have a vertex that is not located on the x-axis, resulting in a parabola that is shifted vertically.
The graph of x² - 6x + 9 = 0 represents a specific case where the parabola is tangent to the x-axis, exhibiting unique properties that set it apart from other quadratic functions.
9. Advanced Concepts and Further Exploration
For more advanced understanding, you can explore:
- Calculus: Finding the derivative to determine the slope of the tangent line at any point on the parabola. This can help in analyzing the rate of change of the function.
- Transformations: Understanding how changing the coefficients (a, b, c) affects the graph's position, shape, and orientation.
- Completing the Square: This algebraic technique can be used to convert any quadratic equation into vertex form, making it easier to identify the vertex and axis of symmetry.
Conclusion
The graph of x² - 6x + 9 = 0, a simple yet insightful quadratic equation, provides a valuable foundation for understanding the behavior of parabolic functions. By analyzing its roots, vertex, axis of symmetry, and concavity, we can fully grasp its properties and appreciate its diverse applications in various fields. This detailed analysis serves as a comprehensive guide, empowering you to confidently tackle more complex quadratic equations and their graphical representations. Further exploration into calculus and algebraic manipulations will enhance your understanding and broaden your ability to analyze and interpret quadratic functions effectively.
Latest Posts
Latest Posts
-
How To Find A Unit Vector
Apr 01, 2025
-
What Is The Least Common Multiple Of 5 And 10
Apr 01, 2025
-
What Is 1 3 As A Percent
Apr 01, 2025
-
Why Does Transcription Occur In The Nucleus
Apr 01, 2025
-
What Is The Gcf Of 27 And 45
Apr 01, 2025
Related Post
Thank you for visiting our website which covers about X 2 6x 9 0 Graph . We hope the information provided has been useful to you. Feel free to contact us if you have any questions or need further assistance. See you next time and don't miss to bookmark.
