The Lines On A Solubility Indicate When Solution Is
listenit
Mar 18, 2025 · 6 min read
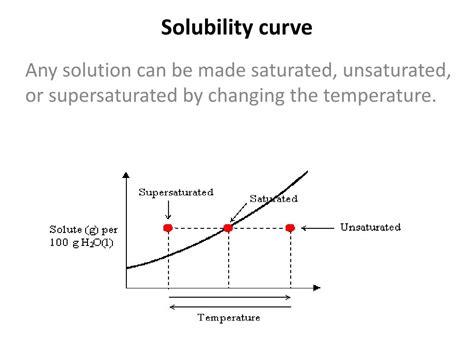
Table of Contents
Decoding the Lines on a Solubility Curve: Understanding Solution Saturation
Solubility curves are fundamental tools in chemistry, providing a visual representation of a substance's solubility in a solvent at various temperatures. Understanding how to interpret these curves is crucial for predicting whether a solution is unsaturated, saturated, or supersaturated. This article delves deep into the intricacies of solubility curves, explaining how the lines on the graph indicate the state of a solution and offering practical examples to solidify your understanding.
Understanding Solubility and its Dependence on Temperature
Before we dive into interpreting solubility curves, let's establish a clear understanding of solubility itself. Solubility refers to the maximum amount of a solute that can dissolve in a given amount of solvent at a specific temperature and pressure to form a stable solution. This maximum amount is often expressed in grams of solute per 100 grams of solvent (g/100g).
Crucially, solubility is temperature-dependent. For most solid solutes, solubility increases with increasing temperature. This means that you can dissolve more of the solid in the solvent as you heat it up. However, there are exceptions; some substances exhibit decreased solubility with increasing temperature. Gases, on the other hand, generally show a decrease in solubility with increasing temperature. This is because higher temperatures provide gas molecules with more kinetic energy, allowing them to escape the solvent more readily.
Deciphering the Solubility Curve: Unsaturated, Saturated, and Supersaturated Solutions
A solubility curve is a graphical representation of the relationship between temperature and solubility. The curve itself depicts the saturation point – the maximum amount of solute that can dissolve at each temperature. The line on the graph represents the boundary between different solution states:
Unsaturated Solutions
A solution is considered unsaturated when it contains less solute than its saturation point at a given temperature. On a solubility curve, any point below the solubility curve represents an unsaturated solution. In these solutions, more solute can be added and will completely dissolve.
Example: Imagine a solubility curve for potassium nitrate (KNO₃) in water. If at 20°C, the solution contains 20 g of KNO₃ per 100 g of water, and the solubility curve indicates that 31.6 g of KNO₃ can dissolve at this temperature, the solution is unsaturated. You can add more KNO₃ to the water and it will still dissolve.
Saturated Solutions
A saturated solution contains the maximum amount of solute that can dissolve in a solvent at a particular temperature. Any point on the solubility curve represents a saturated solution. In a saturated solution, the rate of dissolution (solute dissolving) is equal to the rate of precipitation (solute coming out of solution). Adding more solute to a saturated solution will not result in increased dissolution; instead, the excess solute will simply settle out of the solution.
Example: Referring back to the KNO₃ example, if at 20°C, the solution contains 31.6 g of KNO₃ per 100 g of water (the point on the curve), the solution is saturated. Adding more KNO₃ will not dissolve; it will remain as a solid at the bottom of the container.
Supersaturated Solutions
A supersaturated solution contains more solute than its saturation point at a given temperature. These solutions are unstable and are typically created by carefully cooling a saturated solution without disturbing it. Any point above the solubility curve represents a supersaturated solution. The slightest disturbance, such as adding a seed crystal or scratching the side of the container, can cause the excess solute to rapidly crystallize out, returning the solution to a saturated state.
Example: If you carefully cool a saturated solution of KNO₃ from a higher temperature (e.g., 60°C) to 20°C without disturbing it, you might end up with a supersaturated solution containing more than 31.6 g of KNO₃ per 100 g of water. However, this is a metastable state. Introducing a small crystal of KNO₃ will trigger rapid crystallization, and the solution will become saturated, with the excess solute precipitating out.
Factors Affecting Solubility Beyond Temperature
While temperature is the primary focus when interpreting solubility curves, several other factors can influence solubility:
-
Pressure: Pressure significantly affects the solubility of gases. Increasing pressure increases the solubility of gases in liquids (Henry's Law). This is why carbonated beverages fizz when opened—the decrease in pressure allows dissolved CO₂ to escape. The effect of pressure on solid solutes is generally negligible.
-
Nature of the solute and solvent: The chemical nature of both the solute and the solvent plays a critical role in solubility. "Like dissolves like" is a fundamental principle: polar solvents tend to dissolve polar solutes, and nonpolar solvents tend to dissolve nonpolar solutes. For example, table salt (NaCl), an ionic compound, dissolves readily in water, a polar solvent, but not in oil, a nonpolar solvent.
-
Presence of other substances: The presence of other dissolved substances in the solvent can affect the solubility of a given solute. This is often called the common ion effect, where the presence of a common ion reduces the solubility of a sparingly soluble salt. Other ions can also influence solubility through complex formation or ion pairing.
Practical Applications of Solubility Curves
Solubility curves find applications in various fields, including:
-
Chemistry: Predicting the conditions for crystallization, recrystallization, and precipitation processes in chemical synthesis and purification.
-
Pharmacy: Determining the appropriate solvent and temperature for dissolving drugs to formulate medications.
-
Environmental Science: Understanding the solubility of pollutants in water bodies to assess environmental risks and design remediation strategies.
-
Geology: Studying the solubility of minerals in groundwater to understand mineral formation and dissolution processes.
Interpreting Solubility Curves: A Step-by-Step Guide
Let's walk through a practical example of interpreting a solubility curve. Consider a solubility curve for a hypothetical solute 'X' in water.
-
Identify the axes: The x-axis usually represents temperature (°C), and the y-axis represents solubility (grams of solute per 100 grams of water, g/100g).
-
Locate the solubility curve: The curve itself represents the saturation point for solute 'X' at different temperatures.
-
Determine the state of the solution: To determine whether a solution is unsaturated, saturated, or supersaturated, identify the temperature and the amount of solute present in the solution.
-
If the point representing the solution lies below the curve: The solution is unsaturated.
-
If the point lies on the curve: The solution is saturated.
-
If the point lies above the curve: The solution is supersaturated.
-
-
Predicting changes: You can use the curve to predict what will happen if you change the temperature or add more solute. For example, if you have a saturated solution at a given temperature, cooling it down could result in precipitation if the new solubility is lower.
Conclusion
Understanding solubility curves is essential for comprehending the behavior of solutions and predicting their properties under varying conditions. By carefully analyzing the position of a point relative to the solubility curve, you can accurately determine whether a solution is unsaturated, saturated, or supersaturated. This knowledge has far-reaching implications across numerous scientific and engineering disciplines. Remember that while temperature plays a dominant role, factors like pressure, the nature of solute and solvent, and the presence of other substances also significantly influence solubility. The more you practice interpreting these curves, the more intuitive and valuable this fundamental concept will become.
Latest Posts
Latest Posts
-
What Is The Absolute Value Of 54
May 09, 2025
-
36 Out Of 45 Is What Percentage
May 09, 2025
-
What Determines Chemical Properties Of An Atom
May 09, 2025
-
Can A Triangle Have 3 Acute Angles
May 09, 2025
-
What Does It Mean For A Solution To Be Saturated
May 09, 2025
Related Post
Thank you for visiting our website which covers about The Lines On A Solubility Indicate When Solution Is . We hope the information provided has been useful to you. Feel free to contact us if you have any questions or need further assistance. See you next time and don't miss to bookmark.