Test Of A Hypothesis Is Called
listenit
Mar 17, 2025 · 6 min read
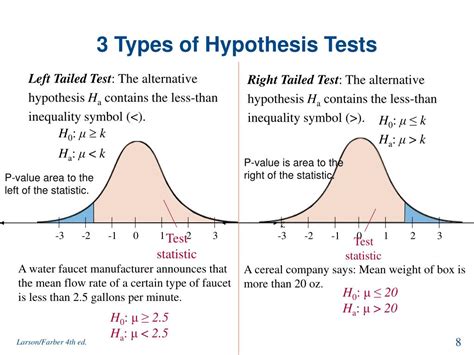
Table of Contents
A Test of a Hypothesis is Called... Statistical Hypothesis Testing!
A cornerstone of statistical inference, the process of testing a hypothesis is formally known as statistical hypothesis testing. It's a crucial methodology used across various disciplines, from medicine and engineering to social sciences and economics, to make informed decisions based on data. Understanding its nuances is key to interpreting research findings accurately and drawing valid conclusions. This comprehensive guide delves into the core concepts, procedures, and interpretations involved in statistical hypothesis testing.
Understanding the Core Concepts
At its heart, statistical hypothesis testing involves formulating a testable statement about a population parameter and then using sample data to evaluate the plausibility of that statement. Let's break down the key components:
1. The Null Hypothesis (H₀):
The null hypothesis is the statement of no effect or no difference. It represents the status quo, the assumption we are trying to disprove. It's often a statement of equality (e.g., "there is no difference in mean blood pressure between two groups"). Formulating a strong null hypothesis is critical for a well-designed test.
2. The Alternative Hypothesis (H₁ or Hₐ):
The alternative hypothesis is the statement that contradicts the null hypothesis. It proposes an effect or difference. It can be directional (one-tailed, specifying the direction of the effect, e.g., "Group A has a higher mean blood pressure than Group B") or non-directional (two-tailed, simply stating a difference exists, e.g., "There is a difference in mean blood pressure between Group A and Group B").
3. Significance Level (α):
The significance level, denoted by alpha (α), is the probability of rejecting the null hypothesis when it is actually true. This is also known as Type I error. Commonly, α is set at 0.05 (5%), meaning there's a 5% chance of incorrectly rejecting a true null hypothesis. Choosing the appropriate significance level depends on the context and the consequences of making a Type I error.
4. p-value:
The p-value is the probability of obtaining the observed results (or more extreme results) if the null hypothesis were true. A small p-value suggests that the observed data are unlikely to have occurred by chance alone if the null hypothesis were true, leading to the rejection of the null hypothesis.
5. Test Statistic:
The test statistic is a numerical value calculated from the sample data. It measures the difference between the observed sample data and what is expected under the null hypothesis. Different statistical tests use different test statistics (e.g., t-statistic, z-statistic, F-statistic, chi-square statistic).
6. Critical Region/Rejection Region:
The critical region or rejection region is the set of values of the test statistic that lead to the rejection of the null hypothesis. The boundaries of this region are determined by the significance level (α) and the chosen statistical test.
7. Decision Rule:
The decision rule specifies when to reject or fail to reject the null hypothesis based on the calculated test statistic and the critical region. If the test statistic falls within the critical region, the null hypothesis is rejected; otherwise, it is not rejected.
Types of Statistical Hypothesis Tests
The choice of statistical test depends on several factors, including:
- Type of data: Nominal, ordinal, interval, or ratio.
- Number of groups being compared: One, two, or more.
- Type of hypothesis: One-tailed or two-tailed.
- Assumptions about the data: Normality, independence, etc.
Here are some commonly used tests:
1. Z-test:
Used to test hypotheses about population means when the population standard deviation is known or the sample size is large (n ≥ 30). Assumes normally distributed data.
2. T-test:
Used to test hypotheses about population means when the population standard deviation is unknown and the sample size is small (n < 30). Also assumes normally distributed data. There are different versions of the t-test:
- One-sample t-test: Compares the mean of a single sample to a known population mean.
- Independent samples t-test: Compares the means of two independent groups.
- Paired samples t-test: Compares the means of two related groups (e.g., before and after measurements on the same individuals).
3. ANOVA (Analysis of Variance):
Used to compare the means of three or more groups. There are different types of ANOVA:
- One-way ANOVA: Compares the means of three or more independent groups.
- Two-way ANOVA: Compares the means of groups based on two independent variables.
4. Chi-square test:
Used to analyze categorical data. It can be used to test for:
- Goodness-of-fit: Whether the observed frequencies of categories match expected frequencies.
- Independence: Whether two categorical variables are independent.
5. Non-parametric tests:
These tests are used when the assumptions of parametric tests (e.g., normality) are not met. Examples include:
- Mann-Whitney U test: Non-parametric equivalent of the independent samples t-test.
- Wilcoxon signed-rank test: Non-parametric equivalent of the paired samples t-test.
- Kruskal-Wallis test: Non-parametric equivalent of one-way ANOVA.
The Steps Involved in Hypothesis Testing
The process of hypothesis testing follows a systematic approach:
- Formulate the null and alternative hypotheses. Clearly define what you are testing.
- Set the significance level (α). This reflects the acceptable risk of Type I error.
- Select the appropriate statistical test. Consider the data type, number of groups, and assumptions.
- Collect and analyze the data. Calculate the test statistic and the p-value.
- Make a decision. Compare the p-value to the significance level (α). If the p-value is less than α, reject the null hypothesis; otherwise, fail to reject the null hypothesis.
- Interpret the results. State your conclusions in the context of the research question.
Errors in Hypothesis Testing
Two types of errors can occur in hypothesis testing:
1. Type I Error:
Rejecting the null hypothesis when it is actually true. The probability of making a Type I error is equal to the significance level (α).
2. Type II Error:
Failing to reject the null hypothesis when it is actually false. The probability of making a Type II error is denoted by β. The power of a test (1-β) is the probability of correctly rejecting a false null hypothesis.
Importance of Statistical Power
Statistical power is the probability of correctly rejecting a false null hypothesis. A high power (typically above 0.80) is desirable to minimize the risk of Type II errors. Power is influenced by several factors, including:
- Sample size: Larger sample sizes generally lead to higher power.
- Effect size: Larger effect sizes (the magnitude of the difference between groups) generally lead to higher power.
- Significance level (α): A higher significance level (e.g., 0.10 instead of 0.05) increases power but also increases the risk of Type I errors.
Conclusion: Mastering the Art of Hypothesis Testing
Statistical hypothesis testing is a powerful tool for drawing inferences from data. Understanding the underlying principles, selecting the appropriate test, and interpreting the results correctly are essential for conducting rigorous research and making sound decisions based on evidence. While the terminology might seem daunting at first, mastering the core concepts of null and alternative hypotheses, p-values, and significance levels is crucial for any researcher or analyst working with data. Remember that hypothesis testing is not about proving something definitively true or false but rather about assessing the strength of evidence against a specific claim, enabling informed decisions in various fields of study. Continuous learning and practice are key to becoming proficient in this fundamental statistical method.
Latest Posts
Latest Posts
-
A Quadrilateral With Two Pairs Of Parallel Sides
Mar 18, 2025
-
1 4 To The Power Of 2
Mar 18, 2025
-
Why Chemical Equations Must Be Balanced
Mar 18, 2025
-
What Part Of Speech Is During
Mar 18, 2025
-
How To Convert Mmhg To Atm
Mar 18, 2025
Related Post
Thank you for visiting our website which covers about Test Of A Hypothesis Is Called . We hope the information provided has been useful to you. Feel free to contact us if you have any questions or need further assistance. See you next time and don't miss to bookmark.
