Graph Of X 4 X 2
listenit
Mar 15, 2025 · 5 min read
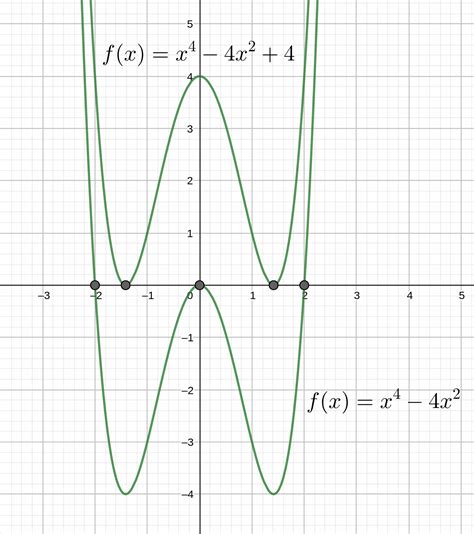
Table of Contents
Unveiling the Secrets of the x⁴ - x² Graph: A Comprehensive Exploration
The graph of the function y = x⁴ - x² is a fascinating exploration into the world of polynomial functions. While seemingly simple at first glance, its behavior reveals intricate details about symmetry, extrema, and the relationship between a function's equation and its visual representation. This comprehensive guide delves deep into the analysis of this quartic function, providing a complete understanding of its characteristics through algebraic manipulation, calculus, and graphical analysis.
Understanding the Basic Function: y = x⁴ - x²
Before diving into the complexities, let's establish a foundation. The function y = x⁴ - x² is a polynomial function of degree four, also known as a quartic function. Its defining characteristic is the presence of the terms x⁴ and x², exhibiting even powers of x. This evenness has significant implications for the graph's symmetry.
Factoring the Polynomial
One crucial step in understanding the graph is factoring the polynomial. We can factor out an x²:
y = x²(x² - 1)
This reveals further factorization, utilizing the difference of squares:
y = x²(x - 1)(x + 1)
These factors immediately tell us something crucial: the function has roots (x-intercepts) at x = -1, x = 0, and x = 1. The root at x = 0 has a multiplicity of 2, meaning the graph touches the x-axis at this point instead of crossing it.
Analyzing the Graph Through Calculus
To fully understand the behavior of the graph, particularly its peaks and valleys (extrema), we need to employ calculus.
First Derivative: Finding Critical Points
The first derivative, f'(x), provides information about the slope of the function at any given point. Let's find the derivative of y = x⁴ - x²:
f'(x) = 4x³ - 2x
Setting f'(x) = 0 to find critical points (where the slope is zero):
4x³ - 2x = 0
2x(2x² - 1) = 0
This gives us three critical points: x = 0, x = 1/√2, and x = -1/√2.
Second Derivative: Determining Concavity and Inflection Points
The second derivative, f''(x), determines the concavity of the function. It helps us distinguish between local maxima and minima. Let's find the second derivative:
f''(x) = 12x² - 2
Setting f''(x) = 0 to find inflection points (where concavity changes):
12x² - 2 = 0
x² = 1/6
x = ±1/√6
These are the points where the concavity of the graph changes.
Classifying Critical Points
By evaluating the second derivative at the critical points, we can classify them:
- x = 0: f''(0) = -2 < 0. This indicates a local maximum at x = 0.
- x = 1/√2: f''(1/√2) = 12(1/6) - 2 = 0. The second derivative test is inconclusive here, so further analysis is needed (discussed below).
- x = -1/√2: f''(-1/√2) = 12(1/6) - 2 = 0. The second derivative test is also inconclusive here.
Further Analysis of Critical Points and Inflection Points
Since the second derivative test failed for x = 1/√2 and x = -1/√2, we need to examine the behavior of the first derivative around these points. Analyzing the sign of the first derivative in the intervals around these critical points reveals:
- Around x = 1/√2: f'(x) changes from positive to negative, indicating a local maximum.
- Around x = -1/√2: f'(x) changes from negative to positive, indicating a local minimum.
Therefore, we have a local maximum at x = 1/√2 and a local minimum at x = -1/√2.
The inflection points at x = ±1/√6 indicate changes in the concavity of the graph. The graph is concave down before x = -1/√6, concave up between x = -1/√6 and x = 1/√6, and concave down again after x = 1/√6.
Symmetry of the Graph
Notice that the function y = x⁴ - x² contains only even powers of x. This signifies an even function, exhibiting symmetry about the y-axis. This means that if you reflect the graph across the y-axis, it remains unchanged.
Plotting the Graph
Combining all our analysis, we can now accurately plot the graph:
- x-intercepts: (-1, 0), (0, 0), (1, 0)
- Local maximum: (0, 0)
- Local maximum: (1/√2, -1/4)
- Local minimum: (-1/√2, -1/4)
- Inflection points: (-1/√6, -5/36), (1/√6, -5/36)
- Symmetry: Symmetric about the y-axis
The graph will exhibit a "W" shape, with a local maximum at (0,0), and local minimums and maximums at approximately (±0.7, -0.25). The inflection points gently alter the curve's shape, making it slightly less sharp at its extrema.
Applications and Extensions
The function y = x⁴ - x² appears in various applications, even though it's a relatively simple function. It serves as a foundation for understanding more complex quartic functions and can be used to model certain phenomena where a symmetric, double-humped curve is needed.
Modifications to the function, such as adding a constant term (shifting vertically) or multiplying by a constant (stretching or compressing vertically), will alter the graph, but the fundamental characteristics of symmetry and the "W" shape remain significant elements of the visualization and understanding of the function's behavior.
Conclusion: A Holistic View
Analyzing the graph of y = x⁴ - x² involves a rich interplay of algebraic manipulation, calculus techniques, and visual interpretation. Through factoring, finding critical points, determining concavity, and understanding symmetry, we've constructed a complete picture of this quartic function. This detailed exploration underscores the importance of connecting the abstract world of equations with the concrete visualization of graphs, providing a powerful tool for understanding mathematical relationships. This process is not only relevant for academic study but also underpins many areas of applied mathematics and modeling in the real world. The meticulous investigation into this seemingly simple function provides a foundational understanding of analytical methods widely applicable to more complex mathematical problems.
Latest Posts
Latest Posts
-
What Is The Electron Configuration For Phosphorus
Mar 15, 2025
-
64 Oz Equals How Many Pounds
Mar 15, 2025
-
How Are Limiting Factors Related To Carrying Capacity
Mar 15, 2025
-
What Percent Is 24 Of 96
Mar 15, 2025
-
8 Of 40 Is What Percent
Mar 15, 2025
Related Post
Thank you for visiting our website which covers about Graph Of X 4 X 2 . We hope the information provided has been useful to you. Feel free to contact us if you have any questions or need further assistance. See you next time and don't miss to bookmark.
