Difference Between Normal And Binomial Distribution
listenit
Mar 22, 2025 · 6 min read
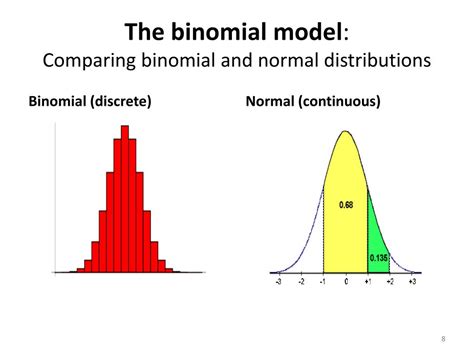
Table of Contents
Delving Deep into the Differences: Normal vs. Binomial Distribution
Understanding probability distributions is fundamental to statistics and data analysis. Two of the most frequently encountered distributions are the normal distribution and the binomial distribution. While seemingly disparate, they share some similarities, yet possess crucial differences that dictate their appropriate applications. This comprehensive guide will delve into the nuances of each, highlighting their key distinctions and guiding you toward selecting the correct distribution for your data analysis tasks.
What is a Normal Distribution?
The normal distribution, also known as the Gaussian distribution or bell curve, is a continuous probability distribution characterized by its symmetrical, bell-shaped curve. Its defining features are its mean (µ) and standard deviation (σ). The mean represents the center of the distribution, while the standard deviation measures the spread or dispersion of the data around the mean.
Key Characteristics of a Normal Distribution:
- Symmetry: The distribution is perfectly symmetrical around the mean. The left and right halves are mirror images of each other.
- Mean, Median, and Mode are Equal: In a normal distribution, the mean, median, and mode all coincide at the center of the distribution.
- Empirical Rule (68-95-99.7 Rule): Approximately 68% of the data falls within one standard deviation of the mean, 95% within two standard deviations, and 99.7% within three standard deviations. This rule is crucial for interpreting data distributed normally.
- Continuous: The normal distribution is continuous, meaning that the variable can take on any value within a given range. You can measure height, weight, or temperature to any degree of precision.
Applications of the Normal Distribution:
The normal distribution's versatility makes it applicable across numerous fields:
- Statistical Inference: Many statistical tests and procedures assume data normality, enabling us to draw inferences about populations based on sample data. Examples include t-tests and ANOVA.
- Quality Control: In manufacturing and industrial processes, the normal distribution is used to monitor process variability and ensure products meet quality standards.
- Natural Phenomena: Numerous natural phenomena, such as human height, blood pressure, and IQ scores, often exhibit approximate normal distributions.
- Financial Modeling: The normal distribution plays a crucial role in financial modeling, particularly in areas like portfolio optimization and risk management. While its applicability is debated due to real-world complexities like "fat tails," it remains a foundational model.
What is a Binomial Distribution?
The binomial distribution is a discrete probability distribution that describes the probability of obtaining a certain number of successes in a fixed number of independent Bernoulli trials. A Bernoulli trial is a random experiment with only two possible outcomes: success or failure.
Key Characteristics of a Binomial Distribution:
- Discrete: The binomial distribution is discrete, meaning that the variable can only take on specific integer values (0, 1, 2, 3,...). For example, the number of heads obtained in 10 coin tosses can only be integers from 0 to 10.
- Fixed Number of Trials (n): The binomial distribution involves a fixed number of independent trials (n).
- Independent Trials: The outcome of each trial does not affect the outcome of any other trial.
- Constant Probability of Success (p): The probability of success (p) remains constant for each trial. The probability of failure is therefore (1-p), often denoted as q.
- Two Outcomes: Each trial results in one of two mutually exclusive outcomes: success or failure.
Applications of the Binomial Distribution:
The binomial distribution finds application in scenarios where the probability of success is constant and trials are independent:
- Quality Control: Determining the number of defective items in a sample from a production line.
- Medical Research: Assessing the effectiveness of a treatment by counting the number of patients who respond positively.
- Genetics: Predicting the probability of inheriting a specific genetic trait.
- Market Research: Estimating the proportion of consumers who prefer a particular product.
Key Differences Between Normal and Binomial Distributions:
The following table summarizes the critical distinctions between normal and binomial distributions:
| Feature | Normal Distribution | Binomial Distribution |
|---|---|---|
| Type | Continuous | Discrete |
| Shape | Symmetrical bell curve | Varies depending on n and p; can be skewed |
| Parameters | Mean (µ) and Standard Deviation (σ) | Number of trials (n) and probability of success (p) |
| Outcomes | Infinite number of possible values within a range | Finite number of possible integer values (0 to n) |
| Independence | Assumes independent observations | Requires independent trials |
| Applications | Wide range, including natural phenomena, inference | Situations with a fixed number of binary outcomes |
When to Use Which Distribution?
Choosing the appropriate distribution is crucial for accurate data analysis. Here’s a guideline:
-
Use Normal Distribution when:
- Your data is continuous.
- Your data is approximately symmetrical.
- Your data exhibits a bell-shaped distribution.
- You need to perform statistical tests that assume normality (t-tests, ANOVA).
-
Use Binomial Distribution when:
- Your data is discrete and represents the number of successes.
- You have a fixed number of independent trials.
- Each trial has only two possible outcomes (success or failure).
- The probability of success is constant for each trial.
Important Note: Many real-world datasets may not perfectly follow a normal or binomial distribution. In such cases, transformations or other statistical techniques might be necessary to improve the fit or use non-parametric methods that don’t assume a specific distribution.
Approximations and Relationships
While distinct, there's an interesting relationship between the normal and binomial distributions:
The Central Limit Theorem: As the number of trials (n) in a binomial distribution increases and the probability of success (p) is not too close to 0 or 1, the binomial distribution approximates a normal distribution. This is a powerful result, allowing us to use normal approximations for calculations that would be computationally intensive with the binomial distribution for large n. This approximation becomes increasingly accurate as n increases.
Continuity Correction: When approximating a binomial distribution with a normal distribution, a continuity correction is often applied to improve accuracy. This involves adding or subtracting 0.5 from the discrete binomial values before calculating probabilities using the continuous normal distribution. This adjustment helps account for the discrete nature of the binomial distribution.
Advanced Considerations: Beyond the Basics
The normal and binomial distributions are foundational, but many other probability distributions exist, each with its own properties and applications. Understanding these distributions is crucial for selecting the appropriate statistical methods and drawing meaningful conclusions from data analysis. For example, the Poisson distribution models the probability of a given number of events occurring in a fixed interval of time or space, while the exponential distribution describes the time until an event occurs in a Poisson process. Understanding these broader contexts enriches your statistical toolkit significantly.
Conclusion: A Powerful Duo in Statistical Analysis
The normal and binomial distributions, despite their differences, are essential tools in the statistician's arsenal. Understanding their distinct characteristics and appropriate applications is paramount for accurate and insightful data analysis. Remember that while the normal distribution is a continuous, symmetrical distribution used for a wide range of applications involving continuous variables, the binomial distribution is a discrete distribution modeling the number of successes in a fixed number of independent trials. By mastering these distributions and their relationship via the Central Limit Theorem, you enhance your capabilities in data interpretation and unlock more refined statistical analysis possibilities. The careful selection of the appropriate distribution directly impacts the validity and reliability of your conclusions, making a deep understanding of their fundamental differences a cornerstone of effective statistical practice.
Latest Posts
Latest Posts
-
What Is 95 Pounds In Kg
Mar 24, 2025
-
What Is The Thinnest Layer Of The Earth Called
Mar 24, 2025
-
What Is The Square Root Of 0 25
Mar 24, 2025
-
What Are The Sides Of Dna Ladder Made Of
Mar 24, 2025
-
Find Equation Of Plane Through Point And Parallel To Plane
Mar 24, 2025
Related Post
Thank you for visiting our website which covers about Difference Between Normal And Binomial Distribution . We hope the information provided has been useful to you. Feel free to contact us if you have any questions or need further assistance. See you next time and don't miss to bookmark.
