Which Graph Represents A Function With Direct Variation
listenit
Mar 18, 2025 · 6 min read
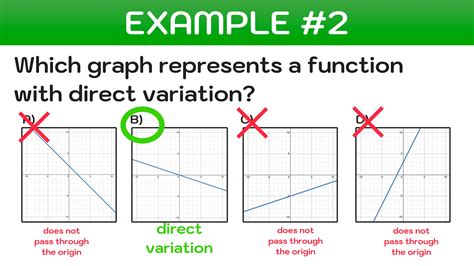
Table of Contents
Which Graph Represents a Function with Direct Variation?
Understanding direct variation is crucial in algebra and beyond. It forms the basis for many real-world applications, from calculating distances based on speed to understanding the relationship between force and acceleration. But how do you visually identify a direct variation using graphs? This comprehensive guide will delve deep into the graphical representation of direct variation, equipping you with the knowledge to confidently identify these functions.
What is Direct Variation?
Before we dive into graphical representations, let's solidify our understanding of direct variation itself. A direct variation, also known as a direct proportion, describes a relationship between two variables where one is a constant multiple of the other. Mathematically, it's represented as:
y = kx
Where:
- y and x are the two variables.
- k is the constant of variation (or constant of proportionality). This constant represents the ratio between y and x. It remains constant throughout the relationship.
This equation tells us that as x increases, y increases proportionally, and as x decreases, y decreases proportionally. The key here is the constant ratio between y and x.
Key Characteristics of Direct Variation Graphs
The graph of a direct variation has several distinct characteristics that make it easily identifiable:
1. Linearity: A Straight Line
The most prominent feature of a direct variation graph is its linearity. It's always represented by a straight line. This is because the relationship between x and y is consistent and predictable; a change in x always results in a proportional change in y.
2. Passing Through the Origin (0,0)
Crucially, the line representing a direct variation always passes through the origin (0,0). This is because when x = 0, y must also equal 0, as dictated by the equation y = kx. If a line doesn't pass through the origin, it does not represent a direct variation.
3. Constant Slope
The slope of the line representing a direct variation is equal to the constant of variation, k. This slope remains constant throughout the entire line. Remember, the slope is the ratio of the vertical change (Δy) to the horizontal change (Δx), and in a direct variation, this ratio is always equal to k. A constant slope visually reinforces the consistent proportionality between x and y.
4. Positive or Negative Slope
The slope, and therefore the constant of variation k, can be either positive or negative.
-
Positive k: Indicates a positive relationship where both x and y increase or decrease together. The graph will have a line that slopes upward from left to right.
-
Negative k: Indicates an inverse relationship where as x increases, y decreases, and vice versa. The graph will have a line that slopes downward from left to right.
Examples of Graphs Representing Direct Variation
Let's illustrate with some examples:
Example 1: Positive Direct Variation
Imagine the relationship between the number of hours worked (x) and the amount earned (y) at a fixed hourly rate of $15. The equation would be:
y = 15x
The graph would be a straight line passing through (0,0) with a positive slope of 15. For every hour worked (increase in x), the earnings increase by $15 (increase in y).
Example 2: Negative Direct Variation
Consider the relationship between the number of days since a product was launched (x) and the amount of that product remaining in stock (y), assuming a constant daily rate of sales. If the initial stock is 1000 units and 100 units are sold daily, the equation could be:
y = -100x + 1000
While it includes an intercept, the core relationship showing the depletion of stock with time, y = -100x, is a negative direct variation. The graph would show a straight line with a negative slope of -100, intersecting the y-axis at 1000. Note that this slightly deviates from the purest form, but the core relationship is one of negative direct variation.
Example 3: Non-Direct Variation
Consider a scenario where the relationship between x and y is represented by the equation y = x² . This is a quadratic equation, and its graph is a parabola, not a straight line. Therefore, it does not represent a direct variation. This highlights the importance of the linear nature of the graph.
How to Identify a Direct Variation Graph
To determine if a graph represents a direct variation, check these three essential points:
-
Is it a straight line? If not, it's not a direct variation.
-
Does it pass through the origin (0,0)? If not, it's not a direct variation.
-
Is the slope constant? You can check this by calculating the slope between different points on the line. If the slope is consistent throughout, it supports the idea of direct variation.
If all three conditions are met, the graph represents a direct variation.
Real-world Applications of Direct Variation Graphs
Understanding direct variation graphs has practical applications across various fields:
-
Physics: Hooke's Law (force is directly proportional to extension), Ohm's Law (voltage is directly proportional to current), and many other physical relationships.
-
Economics: Understanding relationships between price and quantity demanded (in certain simplified models).
-
Engineering: Calculating stress and strain, or load and deflection in structural elements.
-
Chemistry: Relating the mass and moles of a substance.
Distinguishing Direct Variation from Other Relationships
It's crucial to differentiate direct variation from other types of relationships, such as inverse variation or partial variation:
-
Inverse Variation: In this case, the product of the variables is constant (xy = k). The graph is a hyperbola, not a straight line.
-
Partial Variation: This involves a combination of a constant term and a direct variation (y = mx + c). The graph is a straight line, but it doesn't pass through the origin (unless c = 0).
Advanced Concepts and Considerations
While the basic form y = kx elegantly depicts direct variation, real-world scenarios might involve more complex equations. For instance, a graph might show a strong linear relationship but not pass exactly through the origin due to measurement errors or other minor influences. In such instances, the presence of a strong linear correlation, passing close to the origin, could suggest a near-direct variation, even if not perfectly represented by y = kx.
Understanding these nuances is crucial for applying direct variation principles in complex real-world contexts. Statistical methods, such as regression analysis, can be employed to determine the best-fit line and assess the strength of the linear relationship, even when minor deviations from a perfect direct variation exist. Such analytical methods provide a more robust approach to evaluating relationships that might appear close to, but not exactly, direct variation.
Conclusion
Identifying direct variation on a graph is a fundamental skill in mathematics. By understanding the key characteristics – linearity, passing through the origin, and a constant slope – you can confidently determine whether a graph depicts a direct proportional relationship. This knowledge is invaluable for interpreting data, solving problems, and understanding various real-world phenomena across multiple disciplines. Remember to always carefully analyze the graph and consider potential complexities that may subtly deviate from the idealized model of y = kx.
Latest Posts
Latest Posts
-
How Many Moles Are In 28 Grams Of Co2
Mar 18, 2025
-
1 2 Kg Is How Many Pounds
Mar 18, 2025
-
What Is 80 Percent Of 20
Mar 18, 2025
-
To Get Rid Of A Fraction Multiply By The
Mar 18, 2025
-
How To Factor X 3 2x 2 X 2
Mar 18, 2025
Related Post
Thank you for visiting our website which covers about Which Graph Represents A Function With Direct Variation . We hope the information provided has been useful to you. Feel free to contact us if you have any questions or need further assistance. See you next time and don't miss to bookmark.
