The Symbol For Sample Standard Deviation Is
listenit
Mar 15, 2025 · 6 min read
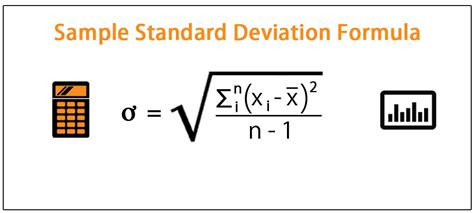
Table of Contents
The Symbol for Sample Standard Deviation: A Deep Dive into Statistical Significance
The symbol for sample standard deviation is s (or sometimes SD). Understanding this seemingly simple symbol unlocks a world of statistical analysis, allowing us to quantify the dispersion or spread of a dataset. This article will delve deep into the meaning, calculation, interpretation, and significance of the sample standard deviation, exploring its crucial role in various statistical applications. We'll also touch upon the differences between sample and population standard deviation, and highlight common misconceptions.
Understanding Standard Deviation: Measuring Data Dispersion
Standard deviation, whether sample or population, is a measure of how spread out a dataset is. A low standard deviation indicates that the data points tend to be clustered closely around the mean (average), while a high standard deviation signifies that the data is more dispersed, with values scattered far from the mean. Imagine two sets of exam scores: one with scores tightly clustered around the average, and another with scores ranging widely. The latter would have a significantly higher standard deviation.
The Importance of Sample Standard Deviation
In most real-world scenarios, we don't have access to the entire population of data. Instead, we work with a sample – a subset of the population. The sample standard deviation, denoted by s, is an estimate of the population standard deviation (σ, sigma). This estimation is crucial because it allows us to infer properties about the entire population based on a smaller, more manageable sample.
Calculating Sample Standard Deviation: A Step-by-Step Guide
The calculation of sample standard deviation involves several steps:
-
Calculate the mean (average) of the sample: Sum all the data points and divide by the number of data points (n). This is represented as
x̄(x-bar). -
Find the deviation of each data point from the mean: Subtract the mean from each individual data point. This gives you a series of deviations (xᵢ - x̄).
-
Square each deviation: Squaring each deviation ensures that positive and negative deviations don't cancel each other out. This step is vital for accurate representation of the overall spread.
-
Sum the squared deviations: Add up all the squared deviations.
-
Divide by (n-1): This is a crucial step. Dividing by (n-1) instead of n provides an unbiased estimator of the population standard deviation. Dividing by n would underestimate the population standard deviation. This adjustment is known as Bessel's correction.
-
Take the square root: Finally, take the square root of the result to obtain the sample standard deviation (s).
Formula:
The formula for sample standard deviation is:
s = √[Σ(xᵢ - x̄)² / (n - 1)]
Where:
sis the sample standard deviationxᵢrepresents each individual data pointx̄is the sample meannis the sample sizeΣdenotes the sum of
Example Calculation
Let's illustrate this with a simple example. Suppose we have a sample of five data points: 2, 4, 6, 8, 10.
-
Mean: (2 + 4 + 6 + 8 + 10) / 5 = 6
-
Deviations: (2-6)=-4, (4-6)=-2, (6-6)=0, (8-6)=2, (10-6)=4
-
Squared Deviations: 16, 4, 0, 4, 16
-
Sum of Squared Deviations: 16 + 4 + 0 + 4 + 16 = 40
-
Divide by (n-1): 40 / (5 - 1) = 10
-
Square Root: √10 ≈ 3.16
Therefore, the sample standard deviation (s) for this dataset is approximately 3.16.
Sample Standard Deviation vs. Population Standard Deviation
It's crucial to understand the difference between sample and population standard deviation. The population standard deviation (σ) describes the spread of an entire population, while the sample standard deviation (s) estimates the population standard deviation based on a sample. The formulas differ slightly, with the population standard deviation using 'n' in the denominator instead of 'n-1'. In practice, however, we usually deal with sample standard deviation because accessing the entire population is often impractical or impossible.
Interpreting Sample Standard Deviation: What Does it Mean?
The value of the sample standard deviation provides valuable insights into the data's characteristics. A larger standard deviation indicates greater variability and less consistency within the data. A smaller standard deviation suggests that the data points are more tightly clustered around the mean, demonstrating higher consistency.
For example, a small standard deviation in manufacturing might signify consistent product quality, while a large standard deviation could indicate inconsistencies requiring attention. In finance, a high standard deviation in stock prices indicates higher volatility and risk.
Applications of Sample Standard Deviation
Sample standard deviation plays a pivotal role in numerous statistical applications, including:
- Hypothesis testing: It's essential for calculating t-statistics and other test statistics used to test hypotheses about population parameters.
- Confidence intervals: It's used to construct confidence intervals, which provide a range of values likely to contain the true population parameter.
- Regression analysis: Standard deviation is used to assess the goodness of fit of regression models and the variability of the residuals.
- Quality control: In manufacturing and other industries, it helps monitor process variability and identify potential problems.
- Descriptive statistics: Provides a concise summary of data variability, alongside measures like the mean and median.
Common Misconceptions about Sample Standard Deviation
Several misconceptions surround the sample standard deviation:
- Confusing it with variance: Variance is the square of the standard deviation. While both measure dispersion, standard deviation is more directly interpretable as it's in the same units as the original data.
- Ignoring the sample size: The sample size significantly influences the reliability of the sample standard deviation as an estimate of the population standard deviation. Larger samples generally provide more accurate estimates.
- Assuming normality: Although frequently used with normally distributed data, the sample standard deviation can be calculated for any data distribution. However, the interpretation might differ depending on the data's underlying distribution.
- Over-reliance on a single value: The standard deviation should always be interpreted in the context of other descriptive statistics, such as the mean, median, and range, to get a complete picture of the data.
Conclusion: The Power of 's'
The symbol 's', representing the sample standard deviation, encapsulates a powerful tool for understanding data variability. It allows us to move beyond simple averages and gain deeper insights into the distribution and spread of a dataset. Whether applied in hypothesis testing, confidence intervals, or quality control, understanding and correctly interpreting the sample standard deviation is fundamental for sound statistical analysis and informed decision-making. Its seemingly simple notation belies its profound importance in a wide range of fields. Mastering its calculation and interpretation unlocks valuable insights into the world of data, enabling us to make better predictions and more informed choices. Remember to always consider the context of your data and utilize other descriptive statistics alongside the sample standard deviation for a holistic understanding of your data.
Latest Posts
Latest Posts
-
What Is The Greatest Common Factor Of 8 And 18
May 09, 2025
-
Actively Dividing Cells Can Be Found In
May 09, 2025
-
Write 35 As A Fraction In Simplest Form
May 09, 2025
-
Which Of The Following Atoms Is The Largest
May 09, 2025
-
What Are Raw Materials For Cellular Respiration
May 09, 2025
Related Post
Thank you for visiting our website which covers about The Symbol For Sample Standard Deviation Is . We hope the information provided has been useful to you. Feel free to contact us if you have any questions or need further assistance. See you next time and don't miss to bookmark.