The Graph Of Quadratic Function Is Called
listenit
Mar 20, 2025 · 6 min read
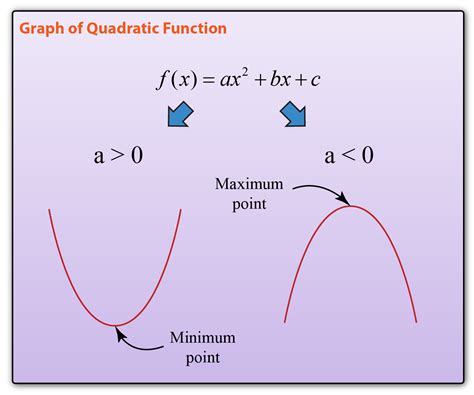
Table of Contents
The Graph of a Quadratic Function is Called a Parabola: A Deep Dive
The graph of a quadratic function is universally known as a parabola. Understanding parabolas is crucial in various fields, from physics (projectile motion) and engineering (designing bridges and antennas) to economics (modeling cost and revenue functions) and computer graphics (creating curved shapes). This comprehensive guide will delve into the properties of parabolas, exploring their characteristics, equations, and applications.
Understanding Quadratic Functions
Before we dive into the specifics of parabolas, let's establish a strong foundation in quadratic functions. A quadratic function is a polynomial function of degree two, meaning the highest power of the variable (typically x) is 2. It can be expressed in the general form:
f(x) = ax² + bx + c
where:
- a, b, and c are constants (real numbers).
- a ≠ 0 (if a = 0, the function becomes linear, not quadratic).
- x is the independent variable.
- f(x) (or y) is the dependent variable.
The value of 'a' plays a crucial role in determining the parabola's orientation and shape. We'll explore this further in the subsequent sections.
Key Features of Quadratic Functions
-
Vertex: The vertex is the lowest point (minimum) or highest point (maximum) on the parabola. It represents the turning point of the function. The x-coordinate of the vertex can be found using the formula: x = -b / 2a. The y-coordinate is obtained by substituting this x-value back into the quadratic function.
-
Axis of Symmetry: This is a vertical line that divides the parabola into two symmetrical halves. The equation of the axis of symmetry is x = -b / 2a, which is the same as the x-coordinate of the vertex.
-
x-intercepts (Roots or Zeros): These are the points where the parabola intersects the x-axis (where y = 0). They can be found by solving the quadratic equation ax² + bx + c = 0. This can be done using factoring, the quadratic formula, or completing the square.
-
y-intercept: This is the point where the parabola intersects the y-axis (where x = 0). It's easily found by substituting x = 0 into the function, resulting in f(0) = c.
The Parabola: Shape and Orientation
The graph of a quadratic function is always a parabola, a U-shaped curve. The parabola's orientation (opening upwards or downwards) and its "width" (how tightly or loosely it curves) are determined by the coefficient 'a':
-
a > 0: The parabola opens upwards (U-shaped), and the vertex represents a minimum value.
-
a < 0: The parabola opens downwards (inverted U-shaped), and the vertex represents a maximum value.
-
|a| > 1: The parabola is narrower than the standard parabola (y = x²). A larger |a| value results in a narrower parabola.
-
0 < |a| < 1: The parabola is wider than the standard parabola. A smaller |a| value results in a wider parabola.
Different Forms of Quadratic Equations and Their Graphs
Quadratic functions can be represented in several forms, each offering unique insights into the parabola's characteristics:
1. Standard Form: f(x) = ax² + bx + c
This is the most common form, readily revealing the y-intercept (c). However, determining the vertex and axis of symmetry requires calculations using the formulas mentioned earlier.
2. Vertex Form: f(x) = a(x - h)² + k
This form directly reveals the vertex (h, k) of the parabola. 'h' represents the x-coordinate of the vertex, and 'k' represents the y-coordinate. The axis of symmetry is simply x = h. This form is particularly useful for graphing and understanding the parabola's transformation from the basic parabola y = x².
3. Factored Form (Intercept Form): f(x) = a(x - r₁)(x - r₂)
This form directly shows the x-intercepts (roots) of the parabola, r₁ and r₂. The parabola intersects the x-axis at x = r₁ and x = r₂. This form is useful for quickly identifying the zeros of the function.
Graphing Parabolas: A Step-by-Step Approach
Graphing a parabola involves identifying its key features and plotting points:
-
Identify the value of 'a': Determine whether the parabola opens upwards (a > 0) or downwards (a < 0) and its width.
-
Find the vertex: Use the formula x = -b / 2a to find the x-coordinate, and substitute it back into the quadratic function to find the y-coordinate.
-
Determine the axis of symmetry: This is the vertical line x = -b / 2a (same as the x-coordinate of the vertex).
-
Find the y-intercept: Substitute x = 0 into the function; the y-intercept is (0, c).
-
Find the x-intercepts (if any): Solve the quadratic equation ax² + bx + c = 0 using factoring, the quadratic formula, or completing the square.
-
Plot the points: Plot the vertex, y-intercept, x-intercepts (if they exist), and a few additional points to refine the shape of the parabola.
-
Sketch the parabola: Draw a smooth curve through the plotted points, ensuring symmetry around the axis of symmetry.
Applications of Parabolas in Real-World Scenarios
Parabolas are not just abstract mathematical concepts; they appear frequently in real-world applications:
-
Projectile Motion: The path of a projectile (e.g., a ball thrown in the air, a rocket) under the influence of gravity follows a parabolic trajectory.
-
Antenna Design: Parabolic reflectors are used in satellite dishes and radar systems to focus signals. The shape concentrates the signals at a focal point.
-
Bridge Design: Parabolic arches are structurally efficient and aesthetically pleasing, often used in bridge construction.
-
Headlights and Reflectors: The parabolic shape of headlight reflectors ensures that the light emitted is focused into a parallel beam.
-
Architectural Design: Parabolas are incorporated into architectural designs for their aesthetic appeal and structural strength.
-
Optimization Problems: In economics and other fields, quadratic functions are used to model cost, revenue, and profit, allowing for the identification of optimal values (maximum profit, minimum cost).
Advanced Concepts Related to Parabolas
For a deeper understanding of parabolas, one can explore advanced concepts such as:
-
Conic Sections: Parabolas are one of the conic sections (along with circles, ellipses, and hyperbolas), formed by the intersection of a plane and a cone.
-
Focus and Directrix: A parabola can be defined as the set of points equidistant from a fixed point (focus) and a fixed line (directrix).
-
Parametric Equations: Parabolas can also be represented using parametric equations, which are useful in various applications like computer graphics.
Conclusion
The graph of a quadratic function is undeniably a parabola. This ubiquitous curve possesses numerous properties and applications across diverse fields. By understanding its characteristics, equations, and graphing techniques, you can unlock a powerful tool for problem-solving and modeling real-world phenomena. This knowledge forms the foundation for further explorations into higher-level mathematics and its practical implications. Through a combination of theoretical understanding and practical application, the fascinating world of parabolas opens up a wide array of possibilities for exploration and innovation.
Latest Posts
Latest Posts
-
Integral Of 1 X 4 1
Mar 20, 2025
-
What Is 67 As A Fraction
Mar 20, 2025
-
Area Of A 9 Inch Circle
Mar 20, 2025
-
How Far Is Jupiter From The Sun In Au
Mar 20, 2025
-
What Is The Base Metric Unit For Mass
Mar 20, 2025
Related Post
Thank you for visiting our website which covers about The Graph Of Quadratic Function Is Called . We hope the information provided has been useful to you. Feel free to contact us if you have any questions or need further assistance. See you next time and don't miss to bookmark.
