How To Graph A Rose Curve
listenit
Mar 25, 2025 · 5 min read
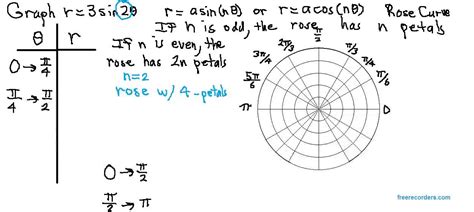
Table of Contents
How to Graph a Rose Curve: A Comprehensive Guide
Rose curves, with their captivating petal-like patterns, offer a fascinating exploration into the world of polar coordinates and mathematical artistry. Understanding how to graph these curves opens a door to creating beautiful and intricate designs, and mastering the process enhances your comprehension of polar graphing techniques. This comprehensive guide will delve into the intricacies of rose curve graphing, equipping you with the knowledge and skills to confidently create your own stunning rose curve designs.
Understanding the Rose Curve Equation
The equation governing rose curves is elegantly simple yet capable of producing a breathtaking array of shapes:
r = a cos(kθ) or r = a sin(kθ)
Where:
- r represents the radial distance from the origin (the center of the graph).
- θ (theta) represents the angle measured from the positive x-axis.
- a is a constant that determines the length of the petals. A larger 'a' value results in longer petals.
- k is a constant that determines the number of petals. This is a crucial parameter shaping the curve's appearance.
The Significance of 'k'
The value of 'k' significantly influences the final form of the rose curve. Let's break down its impact:
- If k is odd: The rose will have 'k' petals. For example, if k = 3, you'll get a three-petal rose.
- If k is even: The rose will have '2k' petals. If k = 4, you'll have an eight-petal rose.
This seemingly subtle difference leads to dramatically different visual outcomes, demonstrating the power of this simple equation.
Step-by-Step Guide to Graphing a Rose Curve
Let's walk through the process of graphing a rose curve, using the example of r = 2cos(3θ). This will give us a three-petal rose.
Step 1: Create a Polar Coordinate System
Begin by drawing a polar coordinate system. This involves:
- A central point: This is your origin (0,0).
- Radial lines: Draw several evenly spaced lines extending outwards from the origin. These represent different angles (θ). Consider using increments of π/6 (30 degrees) or π/4 (45 degrees) for easier calculations.
- Concentric circles: Draw concentric circles around the origin. These circles represent different radial distances (r).
Step 2: Choose Values for θ
Select various values for θ, typically starting at 0 and progressing in increments of your choosing (e.g., π/6, π/4, π/2, etc.). A wider range of θ values will provide a more complete representation of the curve. For our example, let's use increments of π/6:
- θ = 0
- θ = π/6
- θ = π/3
- θ = π/2
- θ = 2π/3
- θ = 5π/6
- θ = π
- θ = 7π/6
- θ = 4π/3
- θ = 3π/2
- θ = 5π/3
- θ = 11π/6
- θ = 2π
Step 3: Calculate the Corresponding 'r' Values
Substitute each θ value into the rose curve equation (r = 2cos(3θ)) to find the corresponding 'r' value. For instance:
- When θ = 0, r = 2cos(3 * 0) = 2
- When θ = π/6, r = 2cos(3 * π/6) = 2cos(π/2) = 0
- When θ = π/3, r = 2cos(3 * π/3) = 2cos(π) = -2 (Note the negative value)
- And so on...
Step 4: Plot the Points
For each pair of (r, θ) values, plot the point on your polar coordinate system. Remember:
- Positive 'r' values: Measure the distance 'r' along the radial line corresponding to angle θ.
- Negative 'r' values: Measure the distance 'r' in the opposite direction along the radial line corresponding to angle θ. This is crucial for accurately portraying the curve.
Step 5: Connect the Points
Once you have plotted several points, smoothly connect them to reveal the shape of the three-petal rose. The curve will exhibit a beautiful, symmetrical pattern.
Graphing Rose Curves with Different 'k' Values
Let's explore the impact of changing the 'k' value in the equation.
r = 2cos(2θ) (k=2): This will produce a four-petal rose (2k = 4 petals). Following the same steps as above, you will find the curve closes upon itself, creating the four distinct petals. Note the difference in petal shape compared to the three-petal rose.
r = 2cos(5θ) (k=5): This will yield a five-petal rose. The process remains the same, but you’ll observe the five distinct petals formed from the plotted points.
r = 2sin(4θ) (k=4): Using the sine function instead of cosine results in a similar eight-petal rose (2k = 8 petals), but the orientation will be rotated. The petals will be positioned differently relative to the axes compared to the cosine version.
Utilizing Technology for Graphing
While manual graphing is a valuable exercise for understanding the underlying principles, technology can greatly simplify the process, especially for complex rose curves with large 'k' values. Numerous graphing calculators and software packages can plot polar equations efficiently, allowing you to visualize intricate patterns effortlessly. You can input the rose curve equation directly and instantly view the graph. This is particularly helpful for exploring the effects of changing 'a' and 'k' values.
Advanced Considerations and Variations
- Inner and Outer Petals: Some rose curves exhibit both inner and outer petals, creating a more complex and visually striking design. This often occurs when 'a' is sufficiently large compared to 'k'.
- Symmetry: Rose curves, particularly those with even 'k' values, display remarkable symmetry. Analyzing this symmetry can provide further insights into the mathematical structure of the curves.
- Variations on the Equation: Exploring variations of the basic equation, such as adding constants or other trigonometric functions, can lead to even more unique and intricate patterns. Experimentation is key to unlocking the full creative potential of rose curves.
- 3D Rose Curves: You can even extend this concept to three dimensions, creating three-dimensional rose curve surfaces. While significantly more complex, the underlying principles of polar coordinates and trigonometric functions still apply.
Conclusion: Embrace the Beauty of Rose Curves
Graphing rose curves is a rewarding journey that combines mathematical precision with artistic expression. By understanding the equation, systematically plotting points, and leveraging technology when necessary, you can create visually stunning and mathematically elegant designs. Whether you prefer the hands-on approach of manual graphing or the efficiency of software tools, exploring the world of rose curves offers an enriching experience for both mathematics enthusiasts and aspiring artists alike. The beauty and complexity of these curves are a testament to the power and elegance of mathematical functions. So, grab your pencil, calculator, or software and start exploring the fascinating world of rose curves today!
Latest Posts
Latest Posts
-
The Basic Unit Of Structure And Function In Living Things
Mar 25, 2025
-
What Is The Lowest Common Multiple Of 8 And 14
Mar 25, 2025
-
Foreshadowing In Of Mice And Men
Mar 25, 2025
-
Is Rotting Wood A Chemical Change
Mar 25, 2025
-
How Do Humans Impact The Phosphorus Cycle
Mar 25, 2025
Related Post
Thank you for visiting our website which covers about How To Graph A Rose Curve . We hope the information provided has been useful to you. Feel free to contact us if you have any questions or need further assistance. See you next time and don't miss to bookmark.
