How Do You Find Phenotypic Ratio
listenit
Mar 19, 2025 · 6 min read
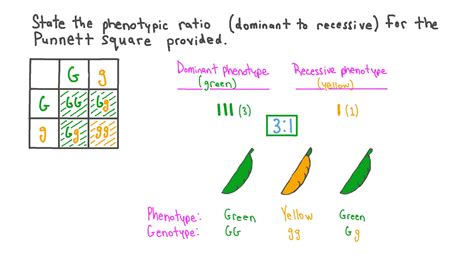
Table of Contents
How Do You Find Phenotypic Ratio? A Comprehensive Guide
Understanding phenotypic ratios is crucial in genetics, providing insights into the inheritance patterns of traits within a population. This comprehensive guide delves deep into the methods and concepts behind determining phenotypic ratios, covering various inheritance patterns and complexities. We'll explore the fundamentals, tackle complex scenarios, and equip you with the skills to accurately predict and analyze phenotypic ratios in different genetic crosses.
Understanding Basic Genetic Terminology
Before we dive into calculating phenotypic ratios, let's refresh some essential genetic terms:
- Gene: A fundamental unit of heredity, carrying the instructions for a specific trait.
- Allele: Different versions of a gene. For example, a gene for flower color might have alleles for red and white.
- Genotype: The genetic makeup of an organism, representing the combination of alleles it possesses (e.g., RR, Rr, rr).
- Phenotype: The observable physical or biochemical characteristics of an organism, determined by its genotype and environmental influences (e.g., red flowers, white flowers).
- Homozygous: Having two identical alleles for a particular gene (e.g., RR, rr).
- Heterozygous: Having two different alleles for a particular gene (e.g., Rr).
- Dominant Allele: An allele that expresses its phenotypic effect even when paired with a recessive allele. Often represented by uppercase letters (e.g., R).
- Recessive Allele: An allele whose phenotypic effect is masked by a dominant allele. Often represented by lowercase letters (e.g., r).
- Punnett Square: A visual tool used to predict the genotypes and phenotypes of offspring from a genetic cross.
Monohybrid Crosses and Phenotypic Ratios
A monohybrid cross involves tracking the inheritance of a single trait. Let's consider a classic example: crossing two heterozygous plants with red flowers (Rr), where 'R' represents the dominant allele for red flowers and 'r' represents the recessive allele for white flowers.
Setting up the Punnett Square
| R | r | |
|---|---|---|
| R | RR | Rr |
| r | Rr | rr |
Determining the Phenotypic Ratio
From the Punnett Square, we can observe the following genotypes and their corresponding phenotypes:
- RR: Red flowers (homozygous dominant)
- Rr: Red flowers (heterozygous)
- rr: White flowers (homozygous recessive)
Counting the phenotypes, we find:
- 3 plants with red flowers
- 1 plant with white flowers
Therefore, the phenotypic ratio for this monohybrid cross is 3:1 (Red:White).
Dihybrid Crosses and Phenotypic Ratios
Dihybrid crosses track the inheritance of two traits simultaneously. Let's consider an example: crossing two heterozygous plants, both exhibiting round yellow peas (RrYy). 'R' represents round peas (dominant), 'r' represents wrinkled peas (recessive), 'Y' represents yellow peas (dominant), and 'y' represents green peas (recessive).
Setting up the Punnett Square (16 squares)
A dihybrid cross requires a 4x4 Punnett square:
     RY  Ry  rY  ry
RY  RRYY RRYyRrYY RrYy
Ry  RRYy RRyyRrYy Rryy
rY  RrYY RrYyrrYY rrYy
ry  RrYy RryyrrYy rryy
Determining the Phenotypic Ratio
Analyzing the 16 possible offspring genotypes, we identify the following phenotypes:
- RRYY, RRYy, RrYY, RrYy: Round yellow peas
- RRyy, Rryy: Round green peas
- rrYY, rrYy: Wrinkled yellow peas
- rryy: Wrinkled green peas
Counting the phenotypes, we have:
- 9 Round yellow peas
- 3 Round green peas
- 3 Wrinkled yellow peas
- 1 Wrinkled green pea
The phenotypic ratio for this dihybrid cross is 9:3:3:1 (Round Yellow:Round Green:Wrinkled Yellow:Wrinkled Green). This classic ratio is observed only when the two genes assort independently, meaning the alleles for one gene don't influence the inheritance of alleles for the other gene.
Beyond Mendelian Ratios: Understanding Deviations
While the 3:1 and 9:3:3:1 ratios are characteristic of simple Mendelian inheritance, many factors can lead to deviations from these expected ratios:
-
Incomplete Dominance: Neither allele is completely dominant, resulting in a blended phenotype. For example, a red flower (RR) crossed with a white flower (rr) might produce pink flowers (Rr). The phenotypic ratio might be 1:2:1 (Red:Pink:White).
-
Codominance: Both alleles are fully expressed, resulting in a phenotype that shows both traits simultaneously. For example, a red flower (RR) crossed with a white flower (rr) might produce flowers with both red and white patches (Rr).
-
Multiple Alleles: More than two alleles exist for a single gene. Human blood type is a classic example, with three alleles (A, B, O) resulting in four blood types (A, B, AB, O). Phenotypic ratios in these cases are more complex and depend on the dominance relationships between the alleles.
-
Epistasis: One gene masks the phenotypic expression of another gene. This can significantly alter expected phenotypic ratios.
-
Pleiotropy: A single gene affects multiple phenotypic traits. This can make it challenging to predict simple phenotypic ratios.
-
Sex-Linked Inheritance: Genes located on sex chromosomes (X and Y) exhibit unique inheritance patterns, often leading to different phenotypic ratios in males and females.
-
Environmental Influences: Environmental factors can affect gene expression and modify the phenotype, leading to deviations from the expected ratios. For instance, temperature can affect flower color in some plants.
-
Linkage: When genes are located close together on the same chromosome, they tend to be inherited together, violating the principle of independent assortment and altering the expected phenotypic ratios. Recombination frequency can be used to map the distance between linked genes.
Analyzing Complex Phenotypic Ratios: A Step-by-Step Approach
When dealing with complex inheritance patterns, a systematic approach is essential:
-
Identify the inheritance pattern: Determine if the traits exhibit complete dominance, incomplete dominance, codominance, epistasis, pleiotropy, sex linkage, or a combination of these patterns.
-
Determine the genotypes of the parents: Carefully assess the parental phenotypes and infer their genotypes based on the inheritance pattern.
-
Construct a Punnett square: The size of the Punnett square depends on the number of genes involved. For dihybrid crosses, a 4x4 square is required; for trihybrid crosses, an 8x8 square, and so on.
-
Determine the genotypes and phenotypes of the offspring: Carefully analyze the Punnett square to identify the genotypes and their corresponding phenotypes.
-
Count the number of individuals for each phenotype: Tally the number of offspring exhibiting each phenotype.
-
Calculate the phenotypic ratio: Express the phenotypic ratio as the proportion of each phenotype observed.
-
Compare the observed ratio to the expected ratio: Compare the observed phenotypic ratio to the expected ratio based on the inheritance pattern. Significant deviations might suggest additional genetic factors or environmental influences.
Chi-Square Test: Evaluating the Goodness of Fit
The chi-square (χ²) test is a statistical method used to assess the goodness of fit between observed and expected phenotypic ratios. This test helps determine if the deviations from the expected ratios are statistically significant or simply due to chance. A low chi-square value indicates a good fit between the observed and expected data, suggesting that the genetic model accurately describes the inheritance pattern. A high chi-square value indicates a poor fit, implying that the genetic model might be inaccurate or other factors are influencing the observed ratios.
Conclusion
Determining phenotypic ratios is a fundamental skill in genetics. While simple Mendelian crosses yield predictable ratios, many factors can influence inheritance patterns, resulting in deviations from these expected ratios. By understanding these complexities, employing a systematic approach, and utilizing statistical methods like the chi-square test, we can accurately analyze and interpret phenotypic ratios, leading to a deeper understanding of genetic inheritance. Remember to carefully consider all possible genetic interactions and environmental influences when interpreting your results. The ability to accurately predict and analyze phenotypic ratios is essential for advancements in various fields, including agriculture, medicine, and evolutionary biology.
Latest Posts
Latest Posts
-
Express Your Answer As A Condensed Structural Formula
May 09, 2025
-
How Many Ounce In A Half Gallon
May 09, 2025
-
Square Root Of 42 In Radical Form
May 09, 2025
-
Why Is The Plasma Membrane Called A Selectively Permeable
May 09, 2025
-
Is A Boiling Point A Physical Property
May 09, 2025
Related Post
Thank you for visiting our website which covers about How Do You Find Phenotypic Ratio . We hope the information provided has been useful to you. Feel free to contact us if you have any questions or need further assistance. See you next time and don't miss to bookmark.