Graph The Inequality Y 2x 1
listenit
Mar 15, 2025 · 5 min read
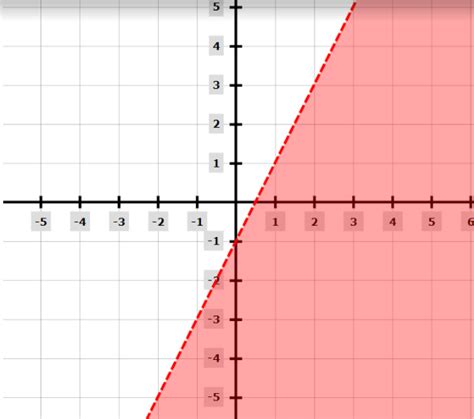
Table of Contents
Graphing the Inequality y ≥ 2x + 1: A Comprehensive Guide
Graphing inequalities might seem daunting at first, but with a structured approach, it becomes a straightforward process. This comprehensive guide will walk you through graphing the inequality y ≥ 2x + 1, explaining the underlying principles and providing you with the tools to tackle similar problems effectively. We'll cover everything from understanding the inequality to interpreting the graph and applying this knowledge to real-world scenarios.
Understanding the Inequality y ≥ 2x + 1
Before we begin graphing, let's dissect the inequality y ≥ 2x + 1. This inequality represents a region on the Cartesian coordinate plane (the x-y plane). The expression 2x + 1 represents a linear equation, and the symbol ≥ (greater than or equal to) signifies that we're interested in all the points where the y-coordinate is greater than or equal to the value of 2x + 1.
Key Components of the Inequality:
y: The dependent variable, whose value depends on the value of x.x: The independent variable. We can choose any value for x.2x: The slope of the line; it indicates the steepness of the line. A slope of 2 means that for every 1 unit increase in x, y increases by 2 units.+1: The y-intercept; this is the point where the line crosses the y-axis (when x = 0). In this case, the y-intercept is 1.≥: This symbol indicates that the inequality includes the line itself (equal to) and the region above the line (greater than). If it were only>, the line would be dashed to show that the points on the line are not included in the solution.
Steps to Graph the Inequality y ≥ 2x + 1
Here's a step-by-step process to graph the inequality:
Step 1: Graph the Boundary Line
First, we graph the equation y = 2x + 1 as if it were an equality. This line forms the boundary of our solution region.
- Find the y-intercept: When x = 0, y = 2(0) + 1 = 1. So, one point on the line is (0, 1).
- Find the x-intercept: When y = 0, 0 = 2x + 1, which gives x = -1/2. So, another point on the line is (-1/2, 0).
- Plot the points and draw the line: Plot the points (0, 1) and (-1/2, 0) on the coordinate plane. Draw a solid line connecting these points because the inequality includes "equal to" (
≥). If the inequality were>or<, the line would be dashed.
Step 2: Determine the Shaded Region
The inequality y ≥ 2x + 1 indicates that we're looking for all points where the y-coordinate is greater than or equal to the value of 2x + 1. This means we need to shade the region above the line y = 2x + 1.
- Test a point: To confirm the shaded region, choose a point not on the line, such as (0, 0). Substitute the coordinates into the inequality: 0 ≥ 2(0) + 1, which simplifies to 0 ≥ 1. This is false, so the region containing (0, 0) is not part of the solution. Therefore, we shade the region above the line.
Step 3: Label the Graph
Finally, label your graph clearly. Include:
- The inequality:
y ≥ 2x + 1 - The axes: Label the x-axis and y-axis.
- Key points: Mark the y-intercept (0, 1) and x-intercept (-1/2, 0) or other significant points.
- Shaded region: Clearly indicate the shaded region representing the solution set.
Interpreting the Graph
The shaded region on your graph represents the solution set of the inequality y ≥ 2x + 1. Every point within this shaded region (including the points on the solid line) satisfies the inequality. This means that for any point (x, y) in the shaded region, the y-coordinate will be greater than or equal to 2 times the x-coordinate plus 1.
Applications of Linear Inequalities
Linear inequalities have numerous applications in various fields:
-
Resource Allocation: Businesses use linear inequalities to optimize resource allocation, determining the best combination of products to maximize profit given constraints on materials, labor, or budget.
-
Production Planning: Manufacturing companies use inequalities to plan production schedules, considering constraints on production capacity and demand forecasts.
-
Finance: Linear inequalities are used in portfolio optimization, helping investors determine the optimal allocation of assets to maximize returns while minimizing risk.
-
Scheduling: Inequalities are vital in scheduling problems, determining the best allocation of time and resources to complete tasks efficiently.
Solving Systems of Inequalities
Often, real-world problems involve more than one inequality. Solving a system of inequalities means finding the region where all inequalities are satisfied simultaneously. The solution region will be the intersection of the individual solution regions for each inequality.
For example, consider the system:
y ≥ 2x + 1
y ≤ -x + 4
To solve this, you would graph each inequality separately and then identify the overlapping shaded region – that region represents the solution to the system.
Advanced Concepts: Non-linear Inequalities
While this guide focuses on linear inequalities, it's important to note that inequality concepts extend to non-linear functions as well. Graphing inequalities involving quadratic functions, exponential functions, or other non-linear functions follows similar principles, but the boundary lines or curves will be different shapes.
Troubleshooting Common Mistakes
-
Incorrect shading: The most common mistake is shading the wrong region. Always test a point to verify your shaded area.
-
Dashed vs. solid lines: Remember to use a dashed line for inequalities with
>or<and a solid line for inequalities with≥or≤. -
Misinterpreting the inequality symbol: Pay close attention to the inequality symbol to ensure you are shading the correct region.
Conclusion
Graphing inequalities, especially linear inequalities like y ≥ 2x + 1, is a fundamental skill in mathematics with far-reaching applications. By understanding the steps involved, interpreting the graph correctly, and practicing with different examples, you can master this essential concept and apply it to solve various problems in various fields. Remember to always test a point to ensure you shade the correct region, and use solid lines for "or equal to" inequalities and dashed lines otherwise. With practice, graphing inequalities will become second nature.
Latest Posts
Latest Posts
-
Why Cant Ions Pass Through The Membrane
Mar 17, 2025
-
What Is 170 Degrees C In Fahrenheit
Mar 17, 2025
-
175 Of What Number Is 42
Mar 17, 2025
-
What Percent Is 20 Out Of 50
Mar 17, 2025
-
What Is The Systematic Name For Mg No3 2
Mar 17, 2025
Related Post
Thank you for visiting our website which covers about Graph The Inequality Y 2x 1 . We hope the information provided has been useful to you. Feel free to contact us if you have any questions or need further assistance. See you next time and don't miss to bookmark.
