Can Be Standard Deviation Be Calc If Not Independent
listenit
Mar 19, 2025 · 6 min read
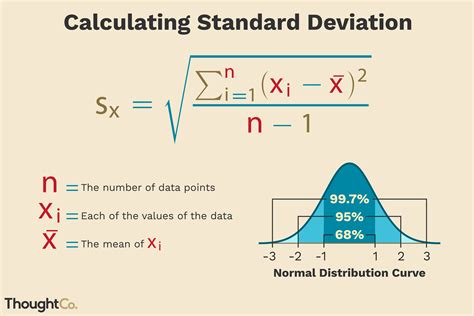
Table of Contents
Can Standard Deviation Be Calculated if Data Points Are Not Independent?
Standard deviation is a fundamental statistical measure reflecting the dispersion or spread of a dataset around its mean. It's a cornerstone of numerous analyses, from simple descriptive statistics to complex hypothesis testing. However, a crucial assumption underlying the standard calculation of standard deviation is the independence of data points. This article delves into the complexities of calculating standard deviation when this assumption is violated, exploring the implications and alternative approaches.
Understanding Independence and its Impact on Standard Deviation
Before we tackle the scenarios where independence is absent, let's solidify our understanding of what independence means in this context. Independent data points imply that the value of one data point doesn't influence the value of another. For instance, the height of one person in a sample is independent of the height of another person if the sample is truly random and representative.
When data points are not independent, we introduce correlation or autocorrelation. This means the values are related in some way. The consequence of ignoring this dependence when calculating standard deviation is a biased and often underestimated result. The standard deviation formula assumes each data point contributes unique information to the overall variability. If data points are correlated, this assumption is false, leading to an inaccurate representation of the true spread.
Consider a simple example: measuring the temperature of a room every hour. These measurements are likely to be highly correlated. A temperature reading at 2 PM is highly likely to be similar to the reading at 3 PM. Simply calculating the standard deviation of these hourly readings would underestimate the true temperature variability throughout the day, as the correlated nature of the data implies less variability than actually exists.
Scenarios Where Independence Is Violated
Non-independence arises in various situations:
1. Time Series Data:
Time series data, such as stock prices, weather patterns, or economic indicators, inherently exhibit autocorrelation. Consecutive observations are often dependent, showing trends or patterns that violate the independence assumption.
2. Spatial Data:
Data collected across geographical locations often demonstrate spatial autocorrelation. Nearby locations tend to have more similar characteristics (e.g., house prices, pollution levels) than those farther apart. Ignoring this spatial dependence will lead to an inaccurate standard deviation.
3. Clustered Samples:
When data is collected from clustered samples (e.g., surveying individuals within families or students within classrooms), the observations within each cluster are likely to be correlated. Individuals within the same cluster might share similar characteristics, making their data points non-independent.
4. Repeated Measurements:
Repeated measurements on the same subject over time (e.g., blood pressure readings) are intrinsically non-independent. The measurements are likely to be correlated because they stem from the same individual.
Consequences of Ignoring Non-Independence
Using the standard deviation formula on non-independent data can result in several issues:
-
Underestimation of Standard Deviation: As previously mentioned, this is a common outcome. The apparent variability is reduced because correlated data points provide redundant information.
-
Incorrect Confidence Intervals: Standard deviation is crucial in constructing confidence intervals, which estimate the range where the true population parameter lies. An underestimated standard deviation leads to narrower, overly confident confidence intervals.
-
Faulty Hypothesis Testing: Many statistical tests rely on the assumption of independent data. Using non-independent data in these tests can inflate the Type I error rate (rejecting a true null hypothesis) and lead to inaccurate conclusions.
-
Misleading Descriptive Statistics: Even for descriptive purposes, an underestimated standard deviation misrepresents the data's true dispersion, providing an incomplete and inaccurate picture of the variability.
Methods for Handling Non-Independent Data
Several techniques can be employed when dealing with non-independent data:
1. Generalized Least Squares (GLS):
GLS is a powerful method that accounts for the correlation structure in the data. It involves modifying the standard least squares estimation to incorporate a correlation matrix reflecting the dependencies among observations. This approach provides more accurate estimates of standard deviation.
2. Autoregressive Integrated Moving Average (ARIMA) Models:
For time series data, ARIMA models are frequently used. These models explicitly model the autocorrelation present in the data, allowing for better estimation and forecasting. The standard deviation can then be derived from the model's residuals, which represent the unexplained variability.
3. Mixed-Effects Models:
For clustered data, mixed-effects models are beneficial. These models separate the variability into within-cluster and between-cluster components. This approach accounts for the correlation within clusters and provides a more accurate assessment of the overall variability.
4. Spatial Statistics Techniques:
Spatial statistics offers various techniques for analyzing spatially correlated data. Methods like geostatistics and spatial regression models explicitly account for spatial autocorrelation, yielding more robust estimates of standard deviation and other statistical parameters.
5. Bootstrapping:
Bootstrapping is a resampling technique that can be used to estimate the standard deviation even when independence is violated. It involves repeatedly sampling with replacement from the original data to create many simulated datasets. The standard deviation is then calculated for each simulated dataset, and the average of these standard deviations provides a robust estimate. This method is particularly useful when the data's correlation structure is unknown or complex.
6. Robust Standard Errors:
Robust standard errors are designed to be less sensitive to violations of the independence assumption. They are calculated using techniques that downweight the influence of outliers and correlated observations, leading to more stable and reliable estimates of standard deviation. These are frequently used in regression analysis when dealing with non-independent errors.
Choosing the Appropriate Method
The best method for handling non-independent data depends on the specific nature of the data and the research question. Consider the following:
- Type of data: Time series, spatial, clustered, or repeated measurements?
- Correlation structure: Is the correlation structure known or unknown? Is it simple or complex?
- Research goals: Descriptive statistics, hypothesis testing, or prediction?
Choosing an appropriate method involves understanding the underlying statistical assumptions and limitations. Often, consulting a statistician is advisable to ensure the proper method is selected and interpreted correctly.
Conclusion
The standard deviation calculation assumes independent data points. Violating this assumption leads to biased and inaccurate results. Understanding the potential consequences is crucial for interpreting statistical analyses correctly. Various methods exist for handling non-independent data, each tailored to different data types and correlation structures. Choosing the right method requires careful consideration of the specific research context and consulting with a statistician whenever uncertainty arises. The accurate estimation of variability is essential for making sound inferences and decisions based on data, hence, acknowledging and addressing the issue of non-independence is paramount in statistical practice. The choice of method should always be justified and clearly communicated in any statistical reporting.
Latest Posts
Latest Posts
-
What Is 2 3 4 Cups Doubled
Mar 19, 2025
-
What Is The Least Common Factor Of 3 And 9
Mar 19, 2025
-
What Is Square Root Of 52
Mar 19, 2025
-
Why Do Plants Need Both Chloroplasts And Mitochondria
Mar 19, 2025
-
What Percentage Is 1 Of 7
Mar 19, 2025
Related Post
Thank you for visiting our website which covers about Can Be Standard Deviation Be Calc If Not Independent . We hope the information provided has been useful to you. Feel free to contact us if you have any questions or need further assistance. See you next time and don't miss to bookmark.
